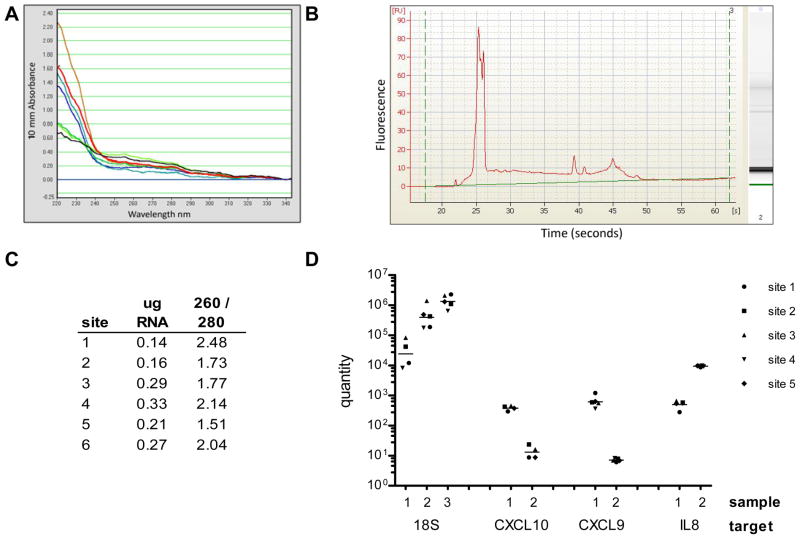
Figure 1.
Evaluation of urine RNA. Using reagents and samples prepared at site one, each laboratory isolated RNA from three urine pellet samples for qPCR analysis. A) Nanodrop absorbance spectra of 7 urine RNA samples isolated at site 1 illustrates typical appearance of urine RNA. B) Agilent Bioanalyzer electropherogram of a representative urine RNA indicates mostly small fragments of RNA; C) Nanodrop OD readings of the RNA isolated from urine pellet 1 in each site, showing normal yield and purity for urine samples; D) qPCR analysis of 3 urine pellet samples for 18S, and two samples for CXCL9, CXCL10, and IL8. All pre-analytical steps were performed at the respective sites using centrally provided reagents. Quantity and grand mean for each target and sample are plotted on a log scale. 18S sample 1 and CXCL10 samples 1 and 2 have one missing data point; all other samples show data from 5 sites.

