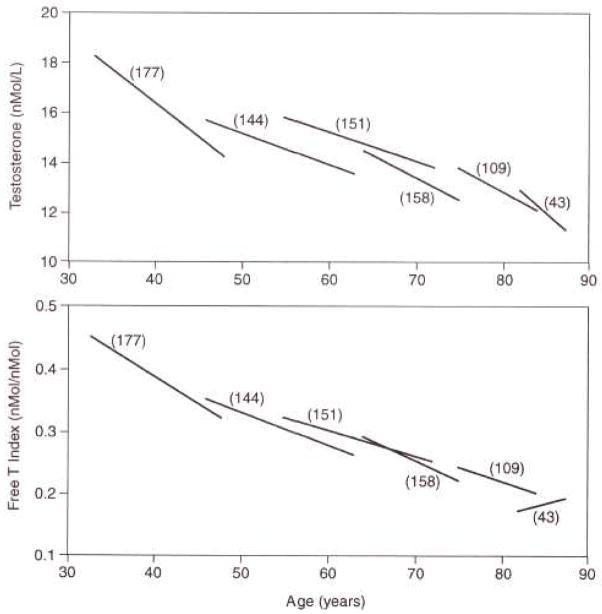
Figure 9.
Longitudinal effects of aging on date-adjusted testosterone and free testosterone index[51]. Linear segment plots for total T and free T index vs. age are shown for men with T and SHBG values on at least two visits. Each linear segment has a slope equal to the mean of the individual longitudinal slopes in each decade, and is centered on the median age, for each cohort of men from the second to the ninth decade. Numbers in parentheses represent the number of men in each cohort. Harman SM, Metter EJ, Tobin JD, Pearson J, Blackman MR: Longitudinal effects of aging on serum total and free testosterone levels in healthy men. Baltimore Longitudinal Study of Aging. J Clin Endocrinol Metab 2001; 86(2): 724–31. Copyright 2001, The Endocrine Society.

