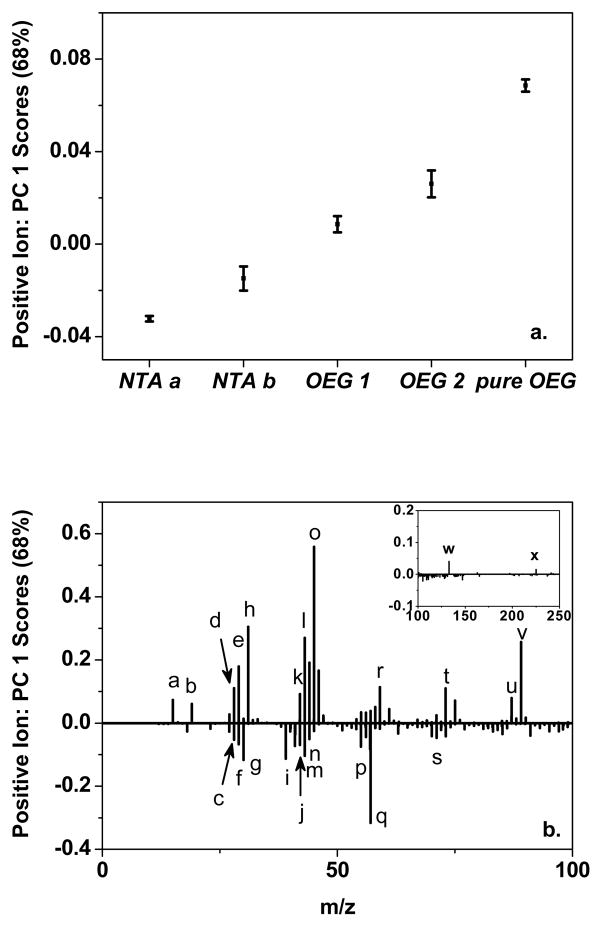
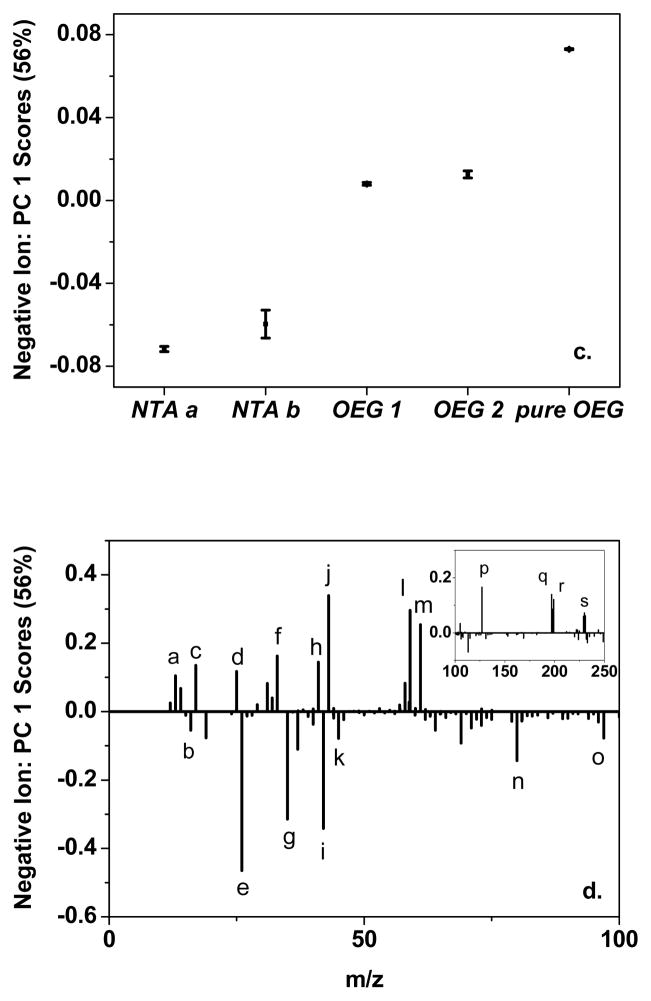
Figure 3.
PCA of the ToF-SIMS data. PC 1 (a) scores and (b) loadings from PCA of the positive ion spectra, and PC 1 (c) scores and (d) loadings from PCA of the negative ion spectra for pure NTA (NTA a and NTA b), 0.5-h backfilled NTA/OEG (OEG 1), 24-h backfill NTA/OEG (OEG 2), and pure OEG (pure OEG) self-assembled monolayers.
The labeled peaks were assigned in Table 4 for positive ion and negative ion spectra.


