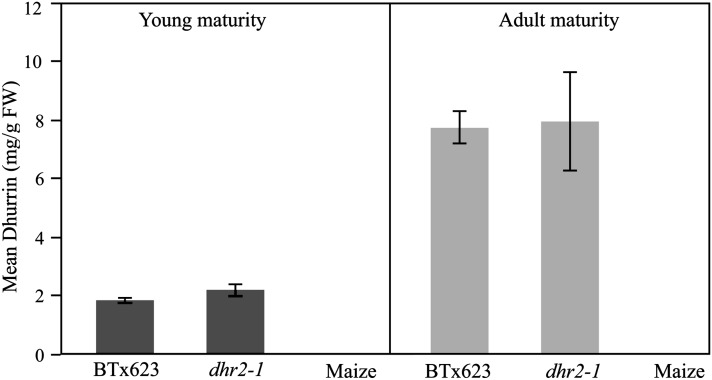
Figure 3.
HPLC analysis was performed to estimate dhurrin content of young seedlings and adult sorghum BTx623 and dhr2-1 mutant plants (mg of dhurrin per g of fresh weight). Similarly developed maize leaves were used as negative controls. Along the x-axis is the dhurrin content and the y-axis represents the mean value of either adult or seedling leaf tissue from sorghum BTx623, dhr2-1 mutant, or maize.

