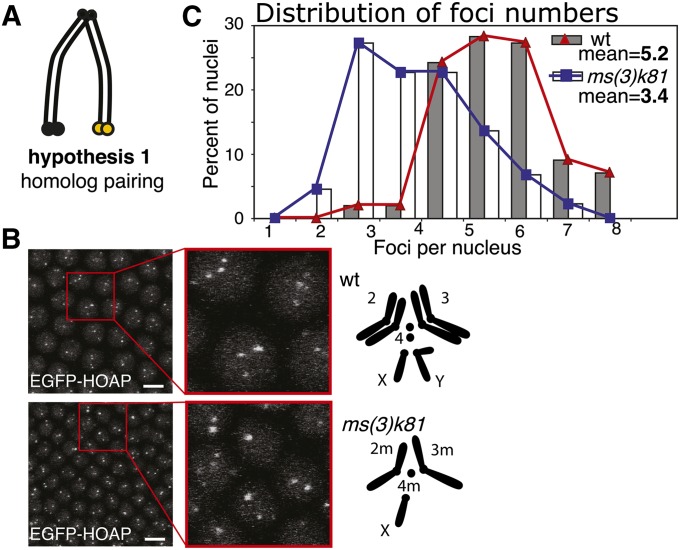
Figure 4.
Test of homolog pairing as a determinant of clustering. (A) Schematic for hypothesis 1, homolog pairing. (B) EGFP-HOAP foci in wt and a haploid embryo; left, confocal projection, with a zoom-in; right, schematic of chromosomes for wt (top) and ms(3)k81 mutant (bottom) as indicated. Bar, 5 μm. (C) A histogram of telomere count distribution from wt (same as the one shown in Figure 1), represented by gray bars and red line, and from ms(3)k81, represented by white bars and blue line (44 nuclei). Means are shown within the graph.

