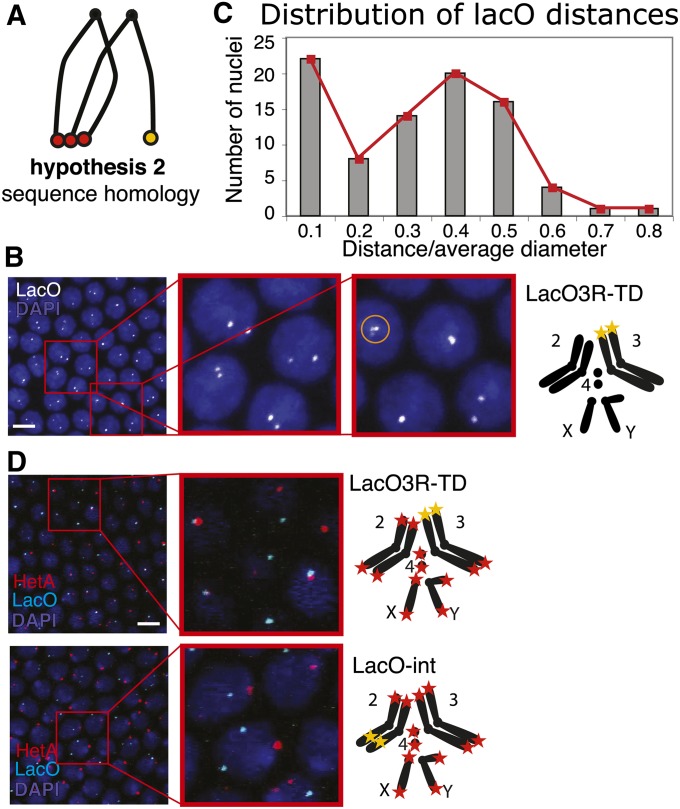
Figure 5.
Test of sequence homology as a determinant of clustering. (A) Schematic for hypothesis 2, sequence homology. (B) Pairing of LacO telomeres. Left, confocal projection of LacO FISH, with two zoom-ins, LacO probe in white, DAPI in blue. Right, genotype and schematic of chromosomes for LacO3R-TD. Telomere 3R is replaced by the LacO array, and LacO is visualized with a LacO probe (yellow star). Sometimes we observed more than two foci in a nucleus (see circled cluster of three foci in second zoom-in). We assume that those were instances where the replicated sister telomeres separated from each other. (C) Histogram of distance between the two LacO signals (n = 85 nuclei, from three embryos). Distance has been normalized by dividing by the average size of the nuclear diameter. (D) Interaction of LacO telomere with retrotransposon telomeres. Left, confocal projections of LacO and HeT-A FISH, with a zoom-in, HeT-A in red, LacO in cyan, and DAPI in blue. Right, genotypes and schematics of chromosomes for LacO3R-TD (top) and LacO-int (bottom). Bars for all, 5 μm.

