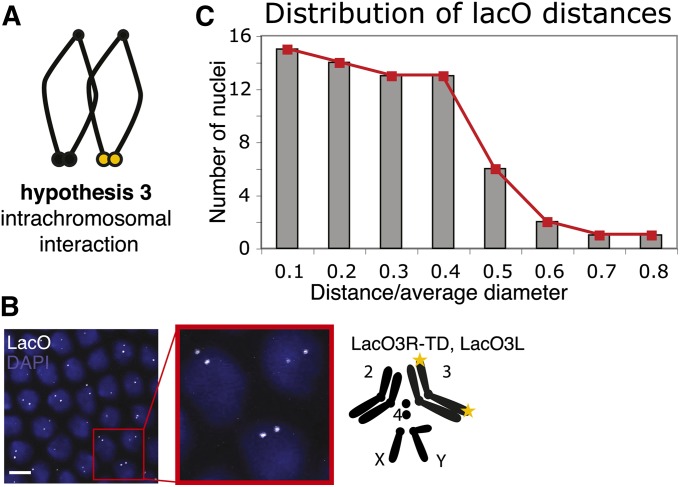
Figure 6.
Test of intrachromosomal interaction as a determinant of clustering. (A) Schematic for hypothesis 3, intrachromosomal interaction. (B) Pairing of chromosome 3 telomeres. Left, confocal projection of LacO FISH, with a zoom-in, LacO probe in white, DAPI in blue. Right, genotype and schematic of chromosomes: telomere 3R is replaced by a LacO array and telomere 3L is marked by a subtelomeric LacO array; both are visualized with a LacO probe (yellow stars). Bar, 5 μm. (C) A histogram of distance between the two LacO signals (n = 65 nuclei, from four embryos). Distance has been normalized as in Figure 5B.

