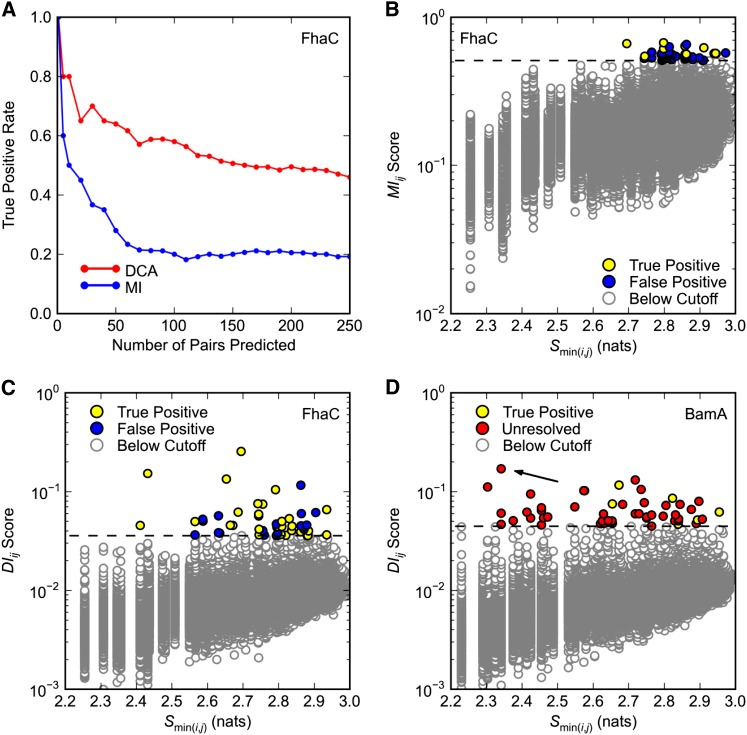
Figure 1.
Covariance analysis of FhaC and BamA. Predicted pairs with a minimum interatomic distance ≤8 Å in (A–C) FhaC structure 2QDZ or (D) BamA structure 3OG5 are considered true positives. Only pairs separated by at least five positions in primary sequence are considered. (A and C) Direct Coupling Analysis (DCA) was applied to FhaC positions 33–584 (see Methods). (A) Comparison of DCA and mutual information (MI) methods. True positive rates are plotted over the top 250 pairs predicted by DCA and MI. (B) Dependence of MIij scores on minimum pair entropy Smin(i,j). MI was applied to FhaC positions 33–584. Dashed black line is the cutoff for pairs with the 50 highest MIij scores. (C and D) Dependence of DIij scores on minimum pair entropy Smin(i,j) for (C) FhaC and (D) BamA. Dashed black line is the cutoff for pairs with the 50 highest DIij scores. (D) DCA was applied to BamA positions 347–810. Since BamA structure 3OG5 comprises only positions 262–421, most pairs are unresolved. There are no false positives in the top 50 predictions. Arrow indicates pair R661–D740.

