Figure 5.
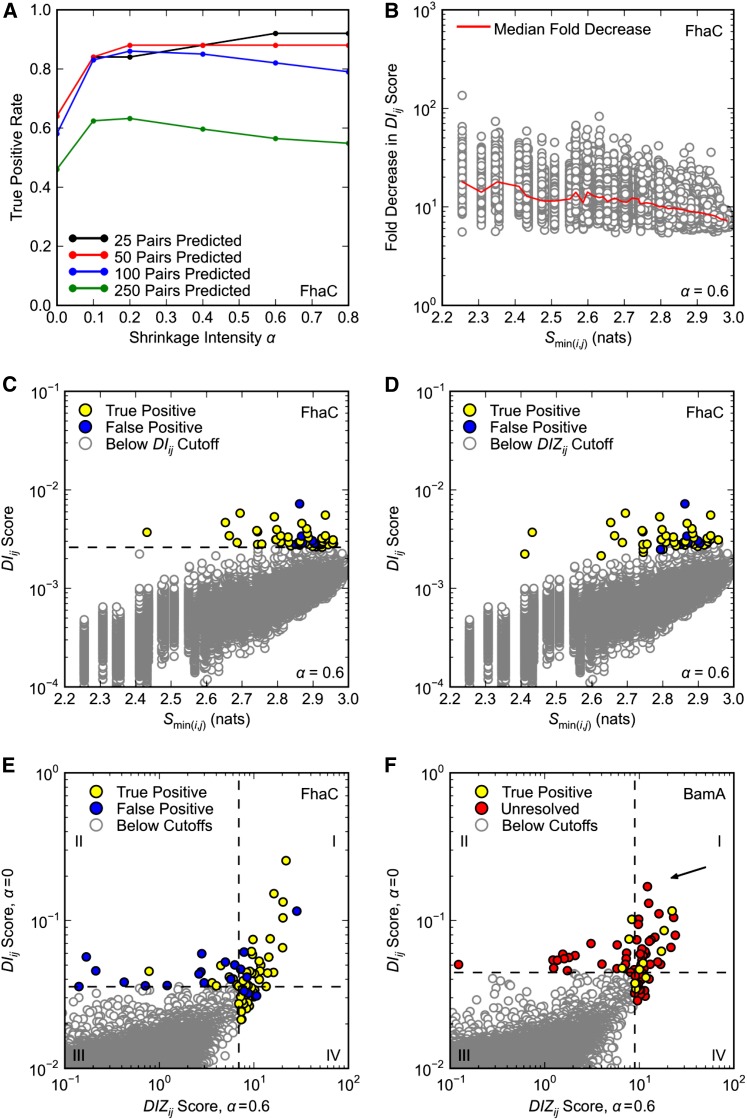
Optimization of DCA. Only pairs separated by at least five positions in primary sequence are considered. (A–E) DCA was applied to FhaC as in Figure 1, A and B, with the same definition of true positives. (A) Effect of shrinkage intensity α on DCA true positive rates. (B) Effect of shrinkage intensity α = 0.6 on DIij scores. Fold reduction in DIij score is plotted against the minimum pair entropy Smin(i,j) for each pair; the red curve shows the median fold reduction in DIij score over 50 bins of Smin(i,j). (C and D) DIij scores for shrinkage intensity α = 0.6 plotted against minimum pair entropy Smin(i,j). The top 50 pairs according to (C) DIij and (D) DIZij scoring (α = 0.6) are highlighted. In C the dashed black line is the cutoff for pairs with the 50 highest DIij scores. (E and F) Overlap of the top 50 (E) FhaC and (F) BamA pairs according to DIij scoring (α = 0) and DIZij scoring (α = 0.6). Horizontal and vertical dashed lines correspond to the cutoffs for pairs with the 50 highest DIij and DIZij scores, respectively. (F) DCA was applied to BamA as in Figure 1D, with the same definition of true positives. There are no false positives. Arrow indicates pair R661–D740.

