Figure 4.
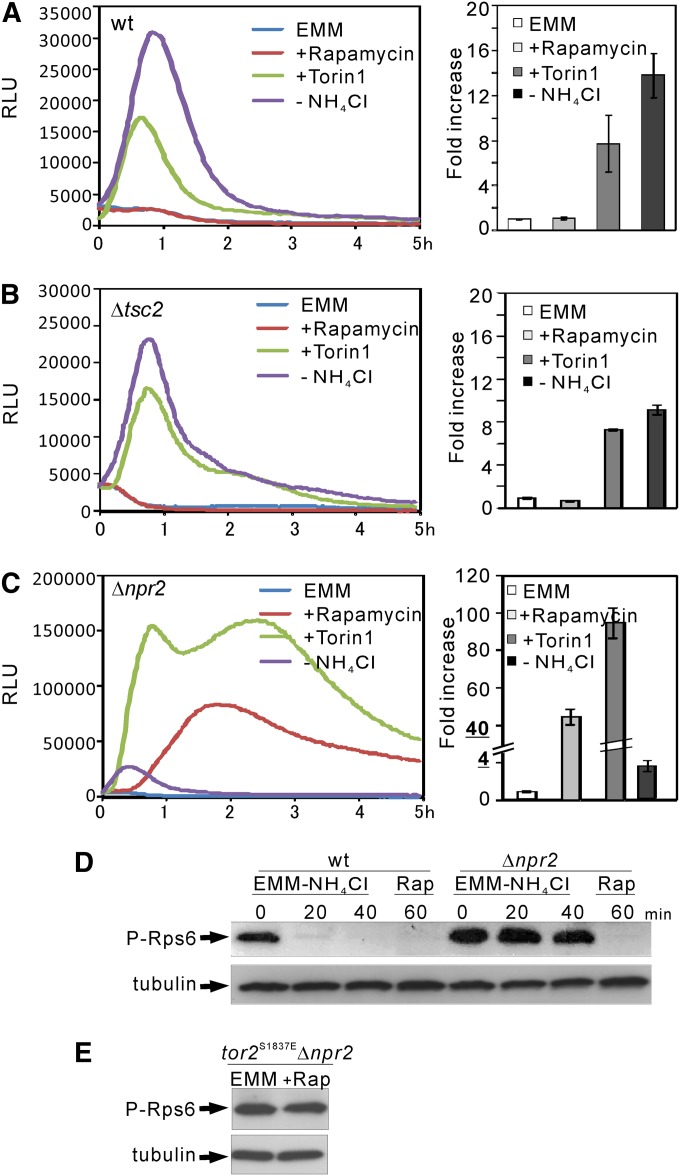
The Δnpr2 and Δtsc2 cells show different phenotypes. (A) The transcriptional activity of the Isp5 promoter in wild-type cells. The wild-type cells harboring the reporter vector pKB8527 were grown to exponential phase and assayed as described in Materials and Methods. The luminescence was followed for 5 hr. The data shown are representative of multiple experiments. (Left) The luminescence, given as relative light units (RLUs), is plotted vs. time. (Right) The data represent the ratio of accumulated RLU value of each sample (nitrogen depletion, rapamycin treatment, or Torin1 treatment) to the basal (EMM). Standard deviations are from three independent experiments, and each sample was analyzed in triplicate. (B and C) The transcriptional activity of the Isp5 promoter in Δtsc2 and Δnpr2 cells. The Δtsc2 or Δnpr2 cells harboring the reporter vector pKB8527 were cultured and assayed as described in A. The data shown are representative of multiple experiments. (D) Nitrogen depletion-induced dephosphorylation of Rps6 is inhibited in Δnpr2 cells. The prototrophic cells of wild-type (KP5080) and Δnpr2 (KP5237) cells were grown at 27° to exponential phase in EMM (0 min). Then the cells were washed three times and transferred to liquid EMM-N for 20 and 40 min. Rapamycin was added to a final concentration of 0.2 μg/ml and incubated for 60 min in EMM media. The proteins were extracted as described in Materials and Methods. The cell lysates were subjected to SDS–PAGE and immunoblotted using anti-PAS polyclonal antibodies. Endogenous tubulin was immunoblotted using anti-α-tubulin antibodies as a loading control. (E) The effect of rapamycin was abolished in tor2S1837EΔnpr2 cells. Rapamycin treatment and immunoblot analysis was performed as described in D.

