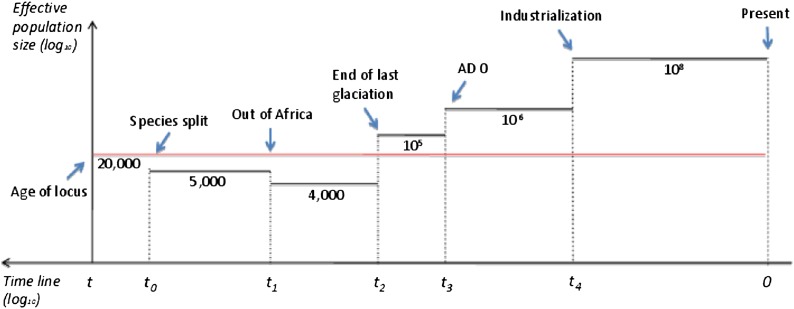
Figure 3.
Scheme of human demographic history with recent bottlenecks and expansions. Black line depicts human population, red line depicts ancestral and chimpanzee populations. t, age of the locus (∼560,000 generations ∼ 11.2 MYA); t0, species split (∼290,000 generations ∼ 5.8 MYA); t1, human migration out of Africa (∼10,000 generations ∼ 200,000 years ago); t2, end of the last glaciation (∼600 generations ∼ 12,000 years ago); t3, ad 0 (∼100 generations ∼ 2000 years ago); t4, beginning of industrialization (∼9 generations ∼ 180 years ago).

