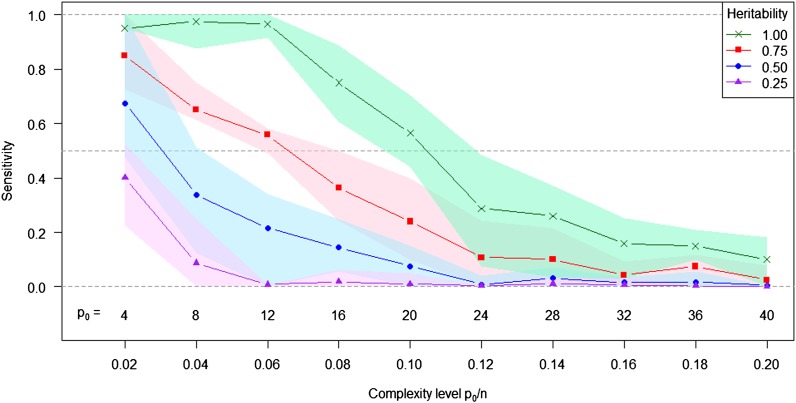
Figure 7.
Sensitivity of LASSO to identify true nonzero coefficients in simulated whole-genome sequence data. The lines indicate the average sensitivity over 10 replications, and the shaded area indicates the range between the 10% and 90% quantiles as a function of the model complexity level and trait heritability. The simulations were conducted according to procedure 1 (Figure S6) with the exception that n = 200 individuals and p = 250,000 markers were used. Heritabilities varied with h2 = 0.25, 0.50, 0.75, and 1.00.

