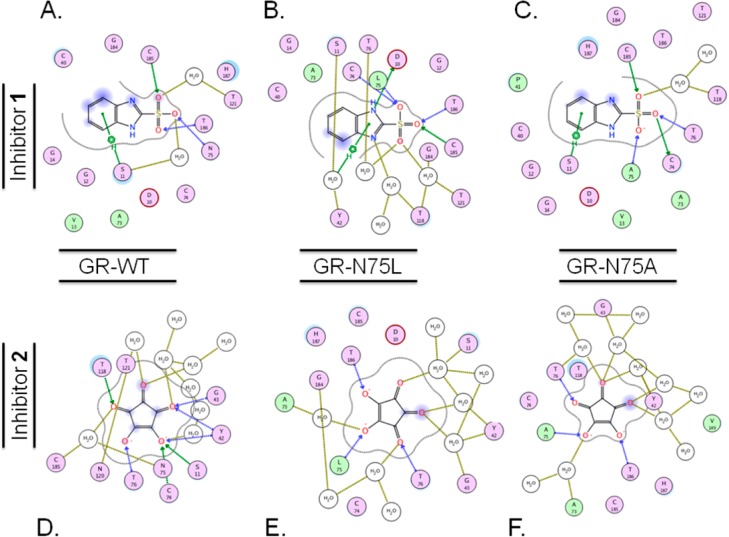
Figure 3.
Ligand interaction maps for the inhibitors, 1 (top) and 2 (bottom), bound to wild-type (A and D) GR-N75L (B and E), and GR-N75A (C and F) active sites support the energetic evaluations conducted via ELR. Maps generated from structures from the final snapshot of a 4-ns MD simulation. Residues are indicated with labeled circles. Direct hydrogen bonding interactions are indicated with blue (backbone) or green (side-chain) dashed lines. Interstitial water-hydrogen bonding interactions are indicated with gold dashed lines. Solvent exposure is indicated with light blue shading, and the active site surface proximal to the ligand is indicated with a gray line.

