Figure 2.
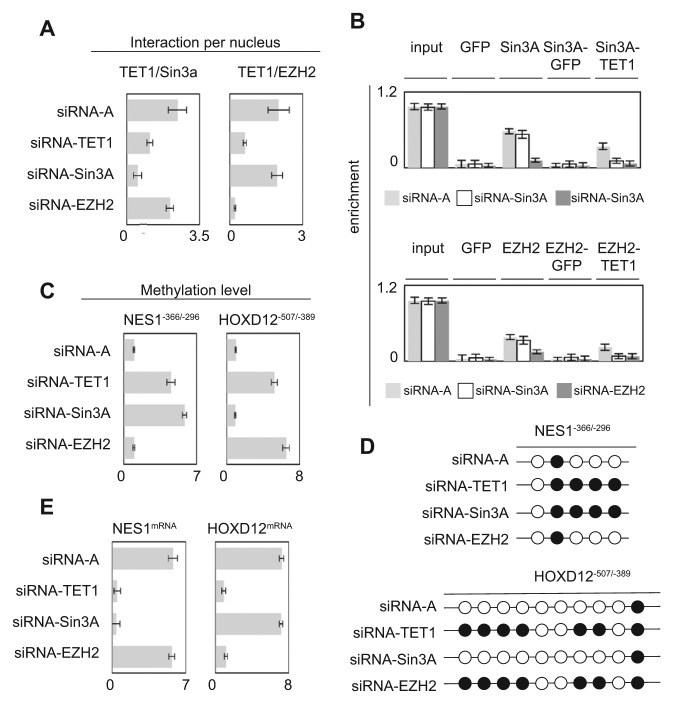
Nonredundant functionality of TET1/EZH2- and TET1/Sin3A-including complexes to the NES1 and HOXD12 genes. (A) Impact of TET1, EZH2, or Sin3A down-regulation on the formation of TET1/EZH2 and TET1/Sin3A interactions. P-LISA experiments were performed 48 hours after siRNA treatment. Graphs represent the mean ± SD of considered interactions quantified by using the freeware BlobFinder from 100 nuclei in 3 independent experiments. (B) Impact of TET1, EZH2, or Sin3A down-regulation on TET1/EZH2 and TET1/Sin3A recruitment on the NES1−366/−296 and HOXD12−507/−389 genes by ChIP and reChIP experiments. Graphs represent the mean ± SD of 3 independent experiments. (C) Impact of TET1, EZH2, or Sin3A down-regulation on methylation of the NES1−366/−296 and HOXD12−507/−389 genes by using the MeDIP method. Graphs represent the mean ± SD of 3 independent experiments. (D) Impact of TET1, EZH2, or Sin3A down-regulation on methylation of the NES1−366/−296 and HOXD12∓507/∓389 genes by using the bisulfite sequencing method. A black circle represents a CpG having a methylation percentage >50%, and an open circle represents a CpG having a methylation percentage <50% (according to data illustrated by Suppl. Fig. S3). (E) Impact of TET1, EZH2, or Sin3A down-regulation on methylation of the NES1−366/−296 and HOXD12−507/−389 genes by using the qPCR method. Graphs represent the mean ± SD of 3 independent experiments.

