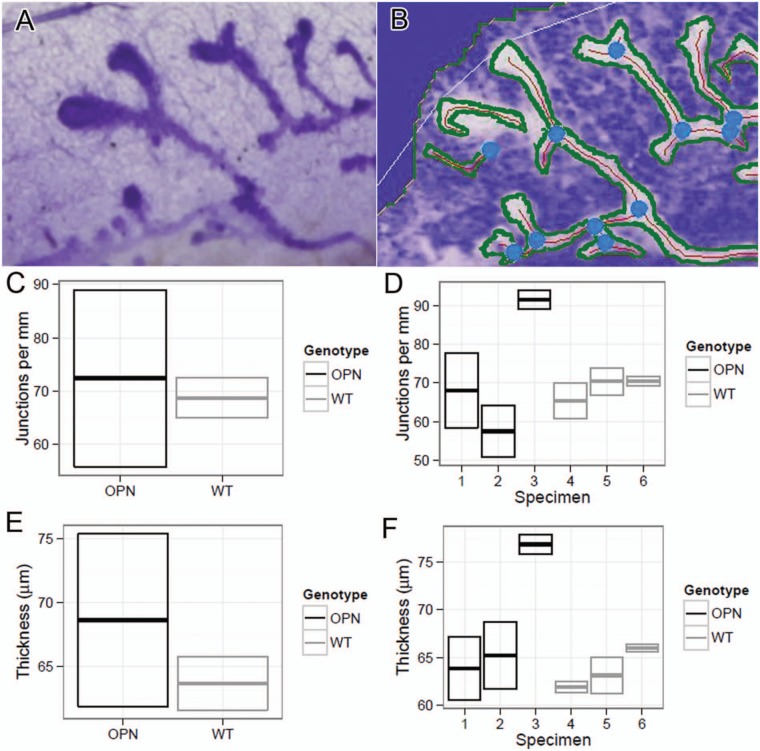
Figure 2.
Quantitation of transgenic osteopontin (Tg-OPN) duct branching and thickness. Quantitation was performed using an original unprocessed image of duct growth (A). Image that was processed as described in Materials and Methods and analyzed using AngioTool (B). In B, blue dots represent branch points, red line represents duct skeleton, and green lines represents duct outline. The white outline is the area used by AngioTool to find the duct structure. Mammary gland (#4) whole mounts from 6-week-old age-matched nulliparious female wild type (WT) and Tg-OPN littermates were photographed for qualitative image analysis and compared quantitatively for junctions per millimeter (C, D) and thickness (E, F).

