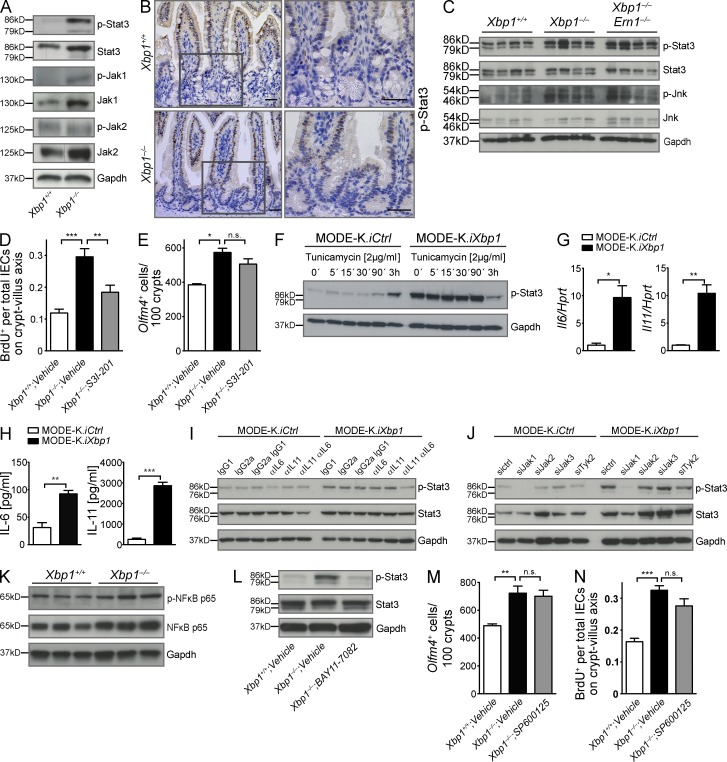
Figure 3.
Hypomorphic Xbp1 leads to Jak1/Stat3 activation in the intestinal epithelium. (A) Immunoblot for p-Stat3, Stat3, p-Jak1, Jak1, p-Jak2, and Jak2 on epithelial colonic scrapings. Data are representative of more than four independent experiments. (B) IHC localizes p-Stat3 immunoreactivity to IECs in the transit-amplifying zone and villus, but largely spares the crypt bottom (n = 3/3). Boxed areas are shown at higher magnification on the right. Bars, 20 µm. (C) Small intestinal epithelial scrapings from the indicated genotypes were analyzed for p-Stat3, Stat3, p-Jnk, and Jnk. The experiment was performed with four mice per group. (D) Mice were treated with the Stat3 inhibitor S3I-201 or vehicle for 14 d, and BrdU was administered 24 h before harvest. The ratio of BrdU+ cells per total IECs along the crypt–villus axis in the small intestine is presented (n = 4/5/7; one-way ANOVA with Bonferroni post-hoc test). (E) Olfm4+ ISCs counted in the same experiment as in D (n = 2/3/3; one-way ANOVA with Bonferroni post-hoc test). (F) MODE-K.iXbp1 and MODE-K.iCtrl cells were stimulated with the ER stress inducer tunicamycin and analyzed for Stat3 Tyr-705 phosphorylation. Data are representative of two independent experiments. (G) Il6 and Il11 mRNA expression in MODE-K.iXbp1 and MODE-K.iCtrl cells (n = 3; two-sided Student’s t test). Data are representative of two independent experiments. (H) Supernatants from MODE-K.iXbp1 and MODE-K.iCtrl cells were analyzed for IL-6 and IL-11 secretion by ELISA (n = 6; two-sided Student’s t test). (I) MODE-K.iXbp1 and MODE-K.iCtrl cells were incubated with anti–IL-11 and anti–IL-6 mAbs or respective isotype control antibodies, and Stat3 Tyr-705 phosphorylation was analyzed in cell lysates. Data are representative of three independent experiments. (J) MODE-K.iXbp1 and MODE-K.iCtrl cells were co-silenced with Jak1-, Jak2-, Jak3-, and Tyk2-specific or scrambled siRNAs, and Stat3 Tyr-705 phosphorylation was analyzed. Data are representative of four independent experiments. (K) IECs of Xbp1+/+(IEC) and Xbp1−/−(IEC) mice were analyzed for p–NF-κB p65 and total NF-κB p65. Data are representative of two independent experiments. (L) The NF-κB inhibitor BAY 11-7082 or vehicle was administered to Xbp1+/+(IEC) and Xbp1−/−(IEC) mice for 2 wk, and Stat3 Tyr-705 phosphorylation was analyzed in small IEC scrapings. Data are representative of three independent experiments. (A, C, F, and I–L) Gapdh was used as a loading control. (M) Mice were treated with the Jnk inhibitor SP600125 or vehicle for 14 d, and Olfm4+ ISCs were counted (n = 5/6/7; one-way ANOVA with Bonferroni post-hoc test). (N) The ratio of BrdU+ cells per total IECs along the crypt–villus axis in the small intestine 24 h after BrdU administration is analyzed in the same experiment as in M (n = 5/6/7; one-way ANOVA with Bonferroni post-hoc test). Graphs show mean ± SEM. *, P < 0.05; **, P < 0.01; ***, P < 0.001.

