Figure 4.
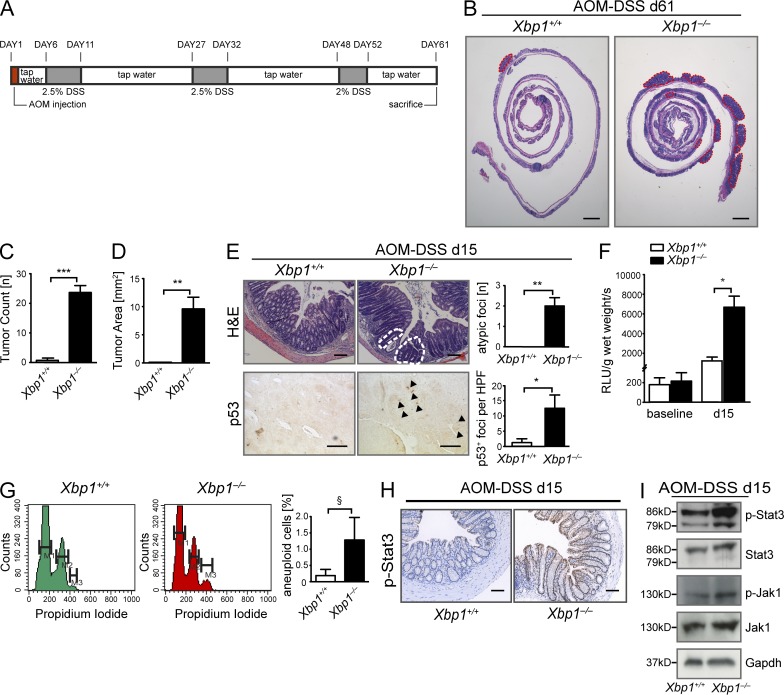
Xbp1 suppresses CAC. (A) Schematic overview of the AOM/DSS CAC model. (B) Representative H&E staining of colon of Xbp1+/+(IEC) and Xbp1−/−(IEC) at day 61 of AOM/DSS colitis. Individual tumors are highlighted by red dashed lines (one of three individual experiments; n = 4/3; total n = 13/10). (C and D) Tumor number (C) and area (D) in Xbp1+/+(IEC) and Xbp1−/−(IEC) at day 61 of AOM/DSS colitis (one of three individual experiments; n = 4/3; total n = 13/10; two-sided Student’s t test). (E, top) Atypical regenerative foci (white dashed lines) identified on H&E stainings on day 15 of AOM/DSS colitis. Number of lesions per colon is shown. (bottom) Staining for p53 was analyzed by IHC (arrowheads, p53+ nuclei; HPF, high power field; n = 4/4; two-sided Student’s t test). (F) ROS in colonic epithelium before (n = 6/7; two-sided Student’s t test) and on day 15 of AOM/DSS (n = 5/5; two-sided Student’s t test). (G) Detection of aneuploidy by analysis of DNA content with propidium iodide in isolated colonic IECs (n = 3/3; one-sided Student’s t test; M1 = G0/G1; M2 = G2/S; M3 = aneuploid). (H) IHC on day 15 of the AOM/DSS model localizes increased p-Stat3 immunoreactivity to IECs (n = 4/4). Bars: (B) 2 mm; (E [top] and H) 50 µm; (E, bottom) 20 µm. (I) Western blot for p-Stat3, Stat3, p-Jak1, and Jak1 on colonic IEC scrapings on day 15 of the AOM/DSS model. Gapdh was used as a loading control. Data are representative of two independent experiments. Graphs show mean ± SEM. §, P = 0.1024; *, P < 0.05; **, P < 0.01; ***, P < 0.001.

