Figure 5.
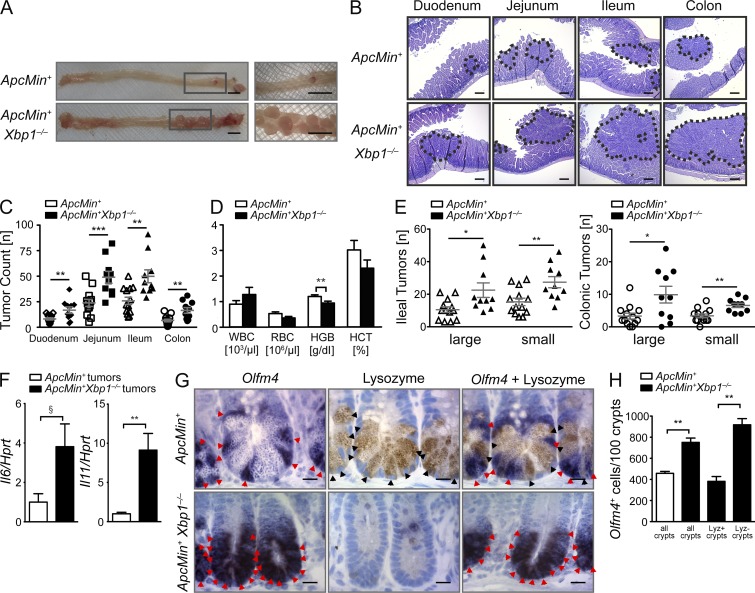
Epithelial Xbp1 suppresses tumor burden in Apcmin mice. (A) Representative macroscopic pictures of the colon with rectal tumors in the indicated genotypes analyzed at age 15 wk (n = 13/10). Boxed areas are shown at higher magnification on the right. (B) Representative H&E-stained sections, with tumors highlighted by dotted lines (n = 13/10). (C) Quantification of tumor numbers per mouse along the intestinal tract (n = 13/10; two-sided Student’s t test). (D) Peripheral blood count of the indicated genotypes at age 15 wk (n = 13/10; two-sided Student’s t test). (E) Ileal and colonic tumor counts in the indicated genotypes stratified by size of tumors (n = 13/10; two-sided Student’s t test). (F) Tumors from colons of Xbp1+/+(IEC);Apcmin and Xbp1−/−(IEC);Apcmin mice were microdissected, and mRNA expression of the indicated targets was analyzed by qPCR (n = 5/5; two-tailed Student’s t test). (G) Olfm4+ ISCs (red arrowheads; ISH) and lysozyme+ Paneth cells (black arrowheads; IHC) in the indicated genotypes (n = 4/4). Bars: (A) 5 mm; (B) 100 µm; (G) 5 µm. (H) Number of Olfm4+ ISCs per 100 crypts in Xbp1+/+(IEC);Apcmin and Xbp1−/−(IEC);Apcmin small intestines. The occasional presence of crypts with lysozyme+ mature Paneth cells among the vast majority of crypts with lysozyme− Paneth cell remnants in Xbp1−/−(IEC);Apcmin mice allowed crypt-specific stratification of Olfm4+ cell enumeration in lysozyme+ and lysozyme− crypts (n = 4/4; two-sided Student’s t test). Graphs show mean ± SEM. §, P = 0.0519; *, P < 0.05; **, P < 0.01; ***, P < 0.001.

