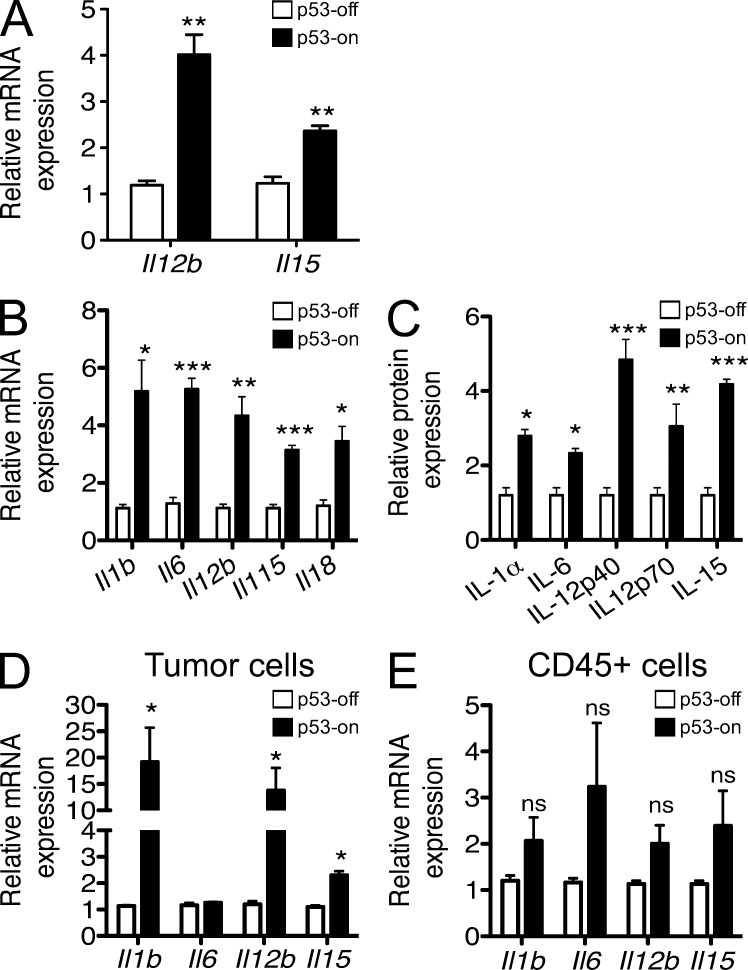
Figure 10.
p53 restoration induces production of numerous cytokines by cells in the tumors. (A) Liver tumor cells were cultivated in vitro with or without 100 ng/ml doxycycline. After 7 d, cells were harvested, RNA prepared, and transcripts encoding various cytokines were quantified by Q-RT-PCR. mRNA amounts were normalized to the 18S rRNA reference. Histograms represent the relative abundance of cytokine mRNAs in p53-on tumors versus p53-off tumors. Values represent means ± SEM for each target. The data are representative of at least three independent experiments. (B and C) Established tumors in Rag2−/− mice were treated or not with doxycycline. 8 d later, tumors were harvested, and single cell suspensions of tumors were processed as described in A (B), or lysates were used to quantify the relative amounts of various cytokine proteins using a protein array (C). Histograms represent the relative abundance of various mRNAs or proteins in p53-on tumors versus p53-off tumors 8 d after initiating treatment with doxycycline. mRNA amounts were normalized to the 18S rRNA reference. Values represent means ± SEM for each target. The data are representative of three independent experiments. (D and E) Established tumors in Rag2−/− mice were prepared as in B and tumor cell suspensions were stained with CD45 antibodies before sorting CD45−GFP+ tumor cells (D) and CD45+GFP− infiltrating hematopoietic cells (E). The populations were processed for Q-RT-PCR as in A, to quantify various cytokine transcripts. mRNA amounts were normalized to the 18S rRNA reference. Student’s t tests were performed comparing p53-off versus p53-on histograms for each target. Values represent means ± SEM from three independent experiments. *, P < 0.05; **, P < 0.01; ***, P < 0.001.

