Figure 4.
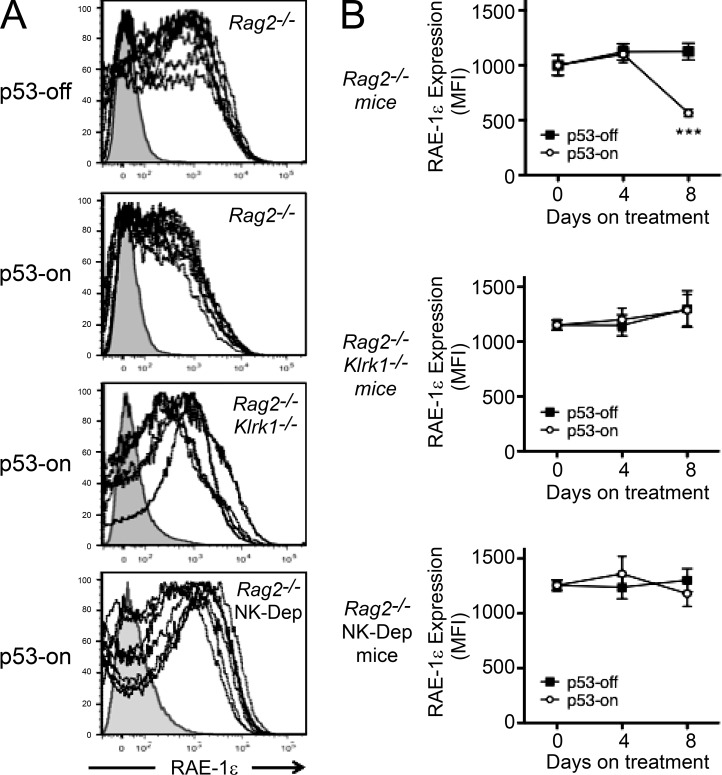
RAE-1ε expression on ex vivo tumor cells. (A) Ex vivo RAE-1ε cell surface expression 8 d after restoring p53 expression, or not, on tumors implanted in Rag2−/−, Rag2−/−Klrk1−/−, and Rag2−/− mice depleted of NK cells (NK-Dep). For each panel, a representative isotype staining (filled gray histogram) was overlaid with n = 7 tumor stainings for RAE-1ε (dotted black lines). The figure depicts combined data from two independent experiments. (B) Graphical depiction of RAE-1ε cell surface expression with or without p53 induction in Rag2−/−, Rag2−/−Klrk1−/−, and NK-depleted Rag2−/− hosts (n = 7 mice per group). The graphs depict averages of the mean fluorescence intensities (MFIs) of RAE-1ε staining on day 0 (before doxycycline treatment), and on days 4 and 8 after beginning treatment, or not, with doxycycline. Values represent means ± SEM for each group (n = 7). Error bars are in some cases smaller than the symbols. Two-way ANOVA and Bonferroni’s tests were performed at each time point. The figure depicts combined data from two independent experiments. ***, P < 0.001.

