Figure 5.
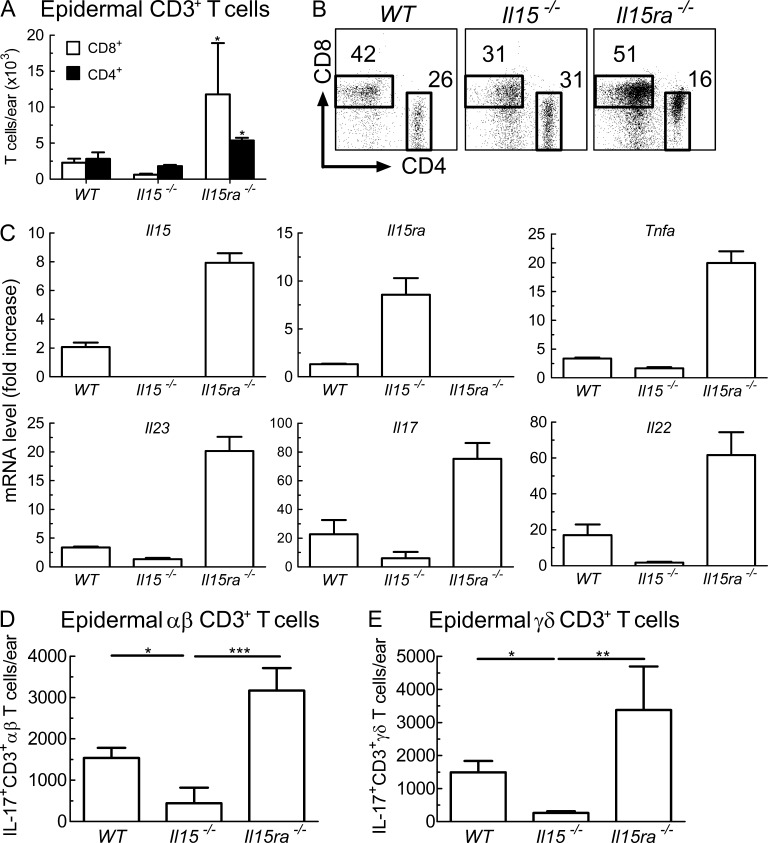
IL-15 drives T cell expansion and production of proinflammatory cytokines. (A and B) WT, Il15−/−, and Il15ra−/− mice were treated for 6 consecutive days with IMQ cream on their right ear. Epidermal skin cells were isolated and analyzed by flow cytometry for T cell subsets. Shown are absolute numbers (A) and dot plots (B) of CD8+ (open bars) and CD4+ (filled bars) CD3+ T cells in indicated animals. (C) mRNA levels of IL-15, IL-15Rα, TNF, IL-23p19, IL-17, and IL-22 were measured by quantitative RT-PCR in ears of WT, Il15−/−, and Il15ra−/− mice treated for 3 consecutive days with IMQ. Shown is fold increase in mRNA normalized to ribosomal protein L27 versus control skin of WT mice. Data are displayed as mean ± SD. (D and E) WT, Il15−/−, and Il15ra−/− mice received IMQ for 3 d, followed by direct ex vivo analysis of intracellular IL-17 production in αβ (D) and γδ T cells (E). Data are pooled results from two to four independent experiments. P-values were determined using one-way ANOVA; *, P < 0.01; **, P < 0.001; ***, P < 0.0001.

