
Figure 3. Regulation of IUCP1 by Lysophospolipids.
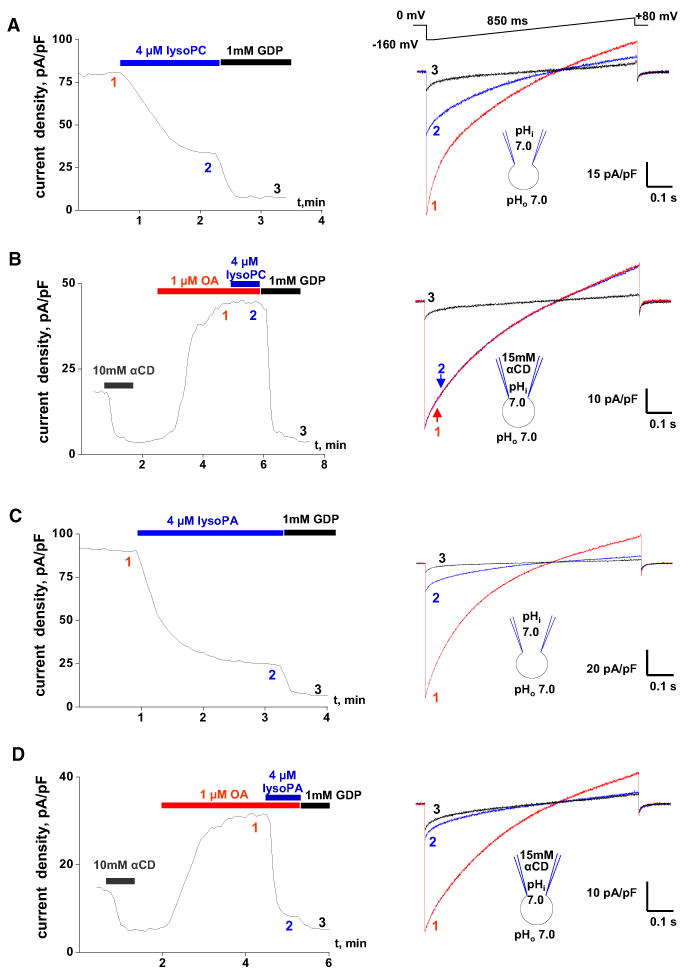
(A) Left panel: Representative time course of the IUCP1 amplitude in control (1), upon the application of 4 mM oleoyl-lysoPC (2), and the subsequent application of 1 mM GDP (3). IUCP1 amplitudes were measured upon stepping from 0 to [C0]160 mV (see right panel). Right panel: IUCP1 traces recorded at times 1, 2, and 3 as indicated in the left panel.
(B) Left panel: Representative time course of the IUCP1 amplitude after the extraction of endogenous LCFAs with 10 mM aCD, reactivation of IUCP1 with 1 mM OA (1), the subsequent addition of 4 mM oleoyl-lysoPC (2), and the application of 1 mM GDP (3). The pipette solution contained 15 mM aCD to extract endogenous membrane LCFAs. Right panel: IUCP1 traces recorded at times 1, 2, and 3 as indicated in the left panel.
(C) The same experiment as in (A) but performed with 4 mM oleoyl-lysoPA instead of oleoyl-lysoPC.
(D) The same experiment as in (B) but performed with 4 mM oleoyl-lysoPA instead of oleoyl-lysoPC.
See also Figure S3.