
Figure 5. H+ Transport by UCP1 Is Coupled to Transport of LCFA Anions.
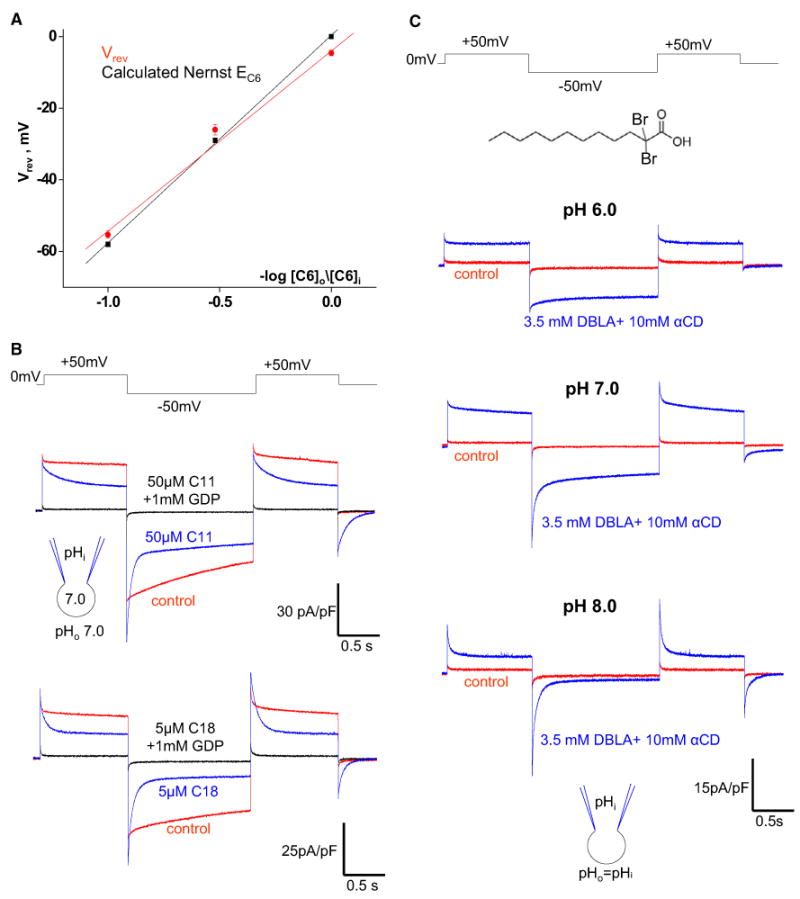
(A) Comparison of reversal potentials (Vrev) of the IUCP1 induced by C6-sulfonate, with C6-sulfonate equilibrium potentials (EC6) predicted by the Nernst equation. The red line indicates the linear fitting of IUCP1 reversal potentials; Vrev versus –log [C6]o/[C6]i, n = 3–6. The black line indicates EC6 calculated by the Nernst equation at 24°C.
(B) Upper panel: The IUCP1 activated by endogenous membrane LCFAs before (control, red) and after the application of 50 μM C11-sulfonate either alone (blue) or in combination with 1 mM GDP (black). Lower panel: The same experiment as in the upper panel but with 5 μM C18-sulfonate.
(C) IUCP1 in 10 mM αCD (control, red) and in 10 mM αCD plus 3.5 mM DBLA (blue) at symmetrical pH 6.0 (upper panel), pH 7.0 (middle panel), and pH 8.0 (lower panel).
Error bars represent SEM. See also Figure S5.