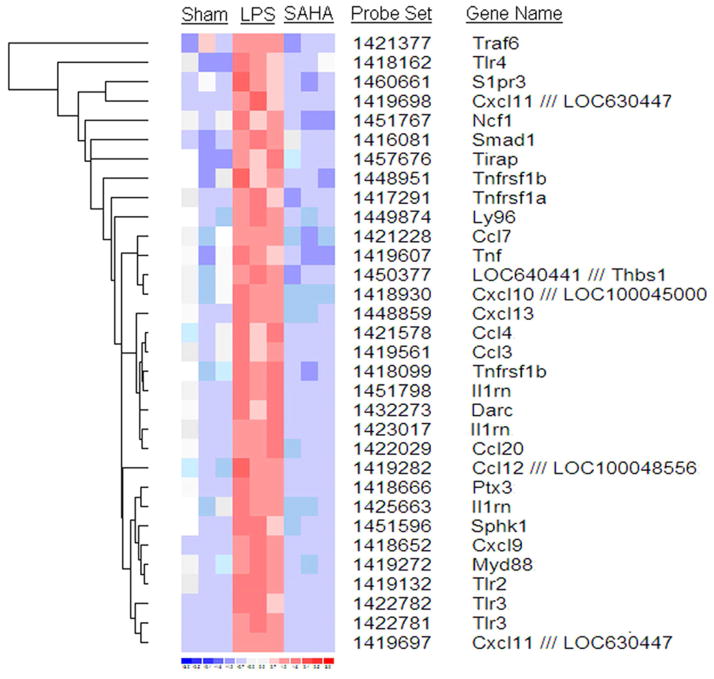
Figure 1. Hierarchical clustering of inflammatory response genes in LPS insult and SAHA treatment.
Each row represents a cDNA on the Affymetrix chip and each column represents an individual lung mRNA sample. Red represents over-expressed genes, and blue represents under-expressed genes. Sham: no LPS and no SAHA treated animals; LPS: lipopolysaccharide (LPS) treated animals; SAHA: suberoylanilide hydroxamic acid (SAHA) plus LPS treated animals.

