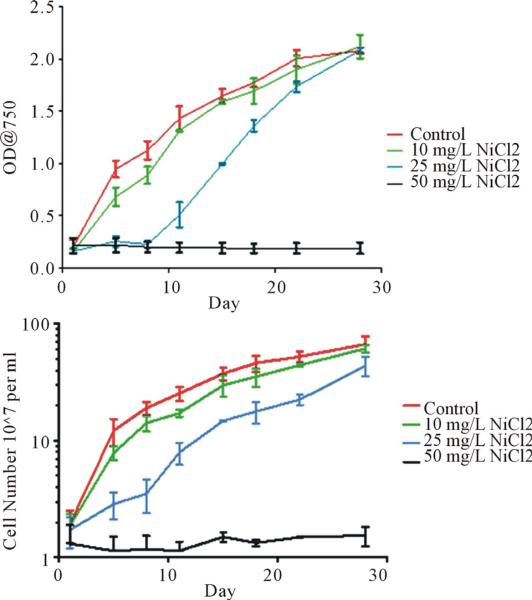
Figure 1.
Growth curves of S. IU 625 with or without nickel chloride stress: 0 (control), 10, 25 and 50 mg/L NiCl2, respectively. Triplicate cultures growth curves were plotted using GraphPad Prism. Top: Turbidity study with optical density at 750 nm of each culture plotted over the time course in days. Bottom: Direct count of cultures.

