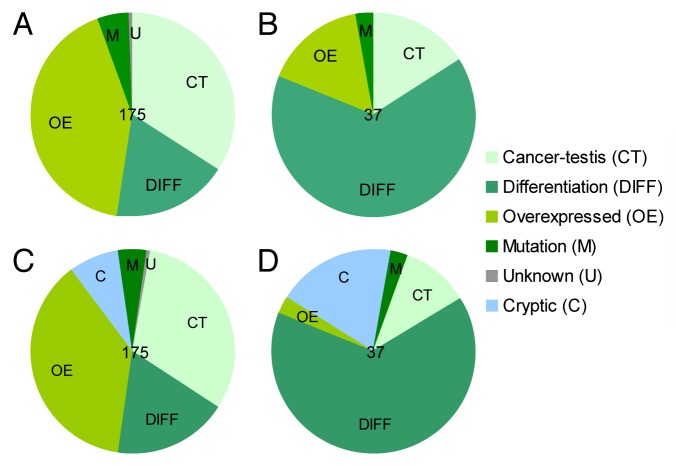
Figure 1. Contribution of tumor-associated antigen classes to T-cell reactivity in melanoma-infiltrating lymphocytes. (A and B) Pie charts show the classification of 175 previously described melanoma-associated T-cell epitopes (A) and the distribution of 37 T-cell responses against these tumor-associated antigens (TAAs) previously detected among tumor-infiltrating lymphocytes (TILs) (B) into classes. Please note that each response is only counted once in each patient.1 (C and D) Pie charts as in (A and B), respectively, with cryptic epitopes considered as a standalone class of TAAs.

An official website of the United States government
Here's how you know
Official websites use .gov
A
.gov website belongs to an official
government organization in the United States.
Secure .gov websites use HTTPS
A lock (
) or https:// means you've safely
connected to the .gov website. Share sensitive
information only on official, secure websites.
