
Figure 2.
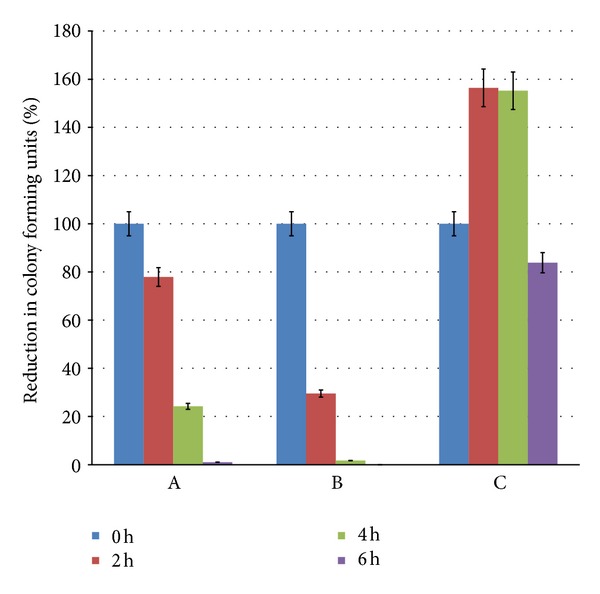
Synergistic action of cefaclor and SL against E. coli. The graphs represent % reduction in colony forming units on exposure to different bioactive agents with respect to time 0, 2, 4 and 6 h. Bars represent A—effect of cefaclor alone, B—effect of cefaclor + SL, and C—effect of SL alone.