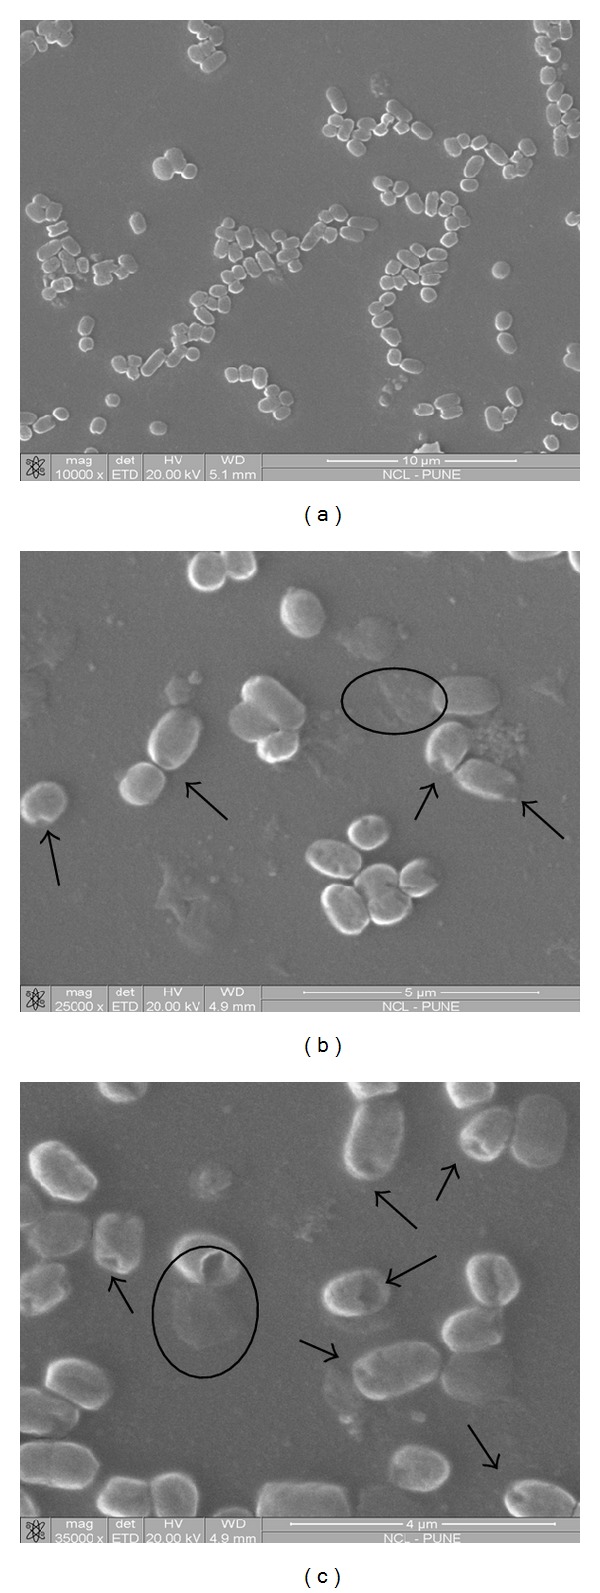
Figure 4.

SEM images of (a) control—untreated E. coli cells and (b) and (c) E. coli cells treated with the mixture of SL and cefaclor. Disturbed cell integrity was evident from the images. Formation of pores (indicated by arrows) was visible with leakage of cytoplasmic contents.
