
Figure 5.
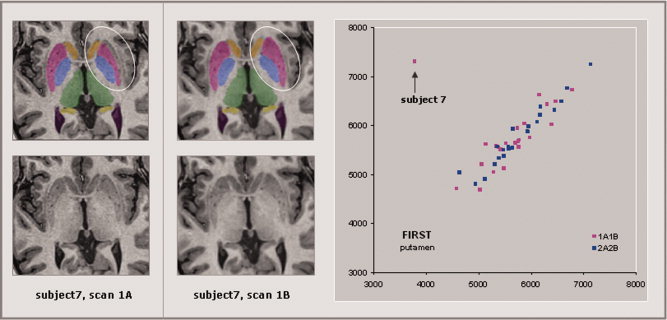
The T1 images and segmentations for subject 7 are shown for scan 1A (left panel) and for scan 1B (center panel). Segmentation of the L‐putamen (circled) is dramatically different on the lateral surface for scan 1A (3,777 voxels) compared to scan 1B (7,317 voxels). This resulted in lower intraclass correlations for 1A1B (0.29) and 1A2A (0.29) as compared to 2A2B (0.96) and 1B2B (0.95). There is no obvious artifact visible in scan 1A that might explain this discrepancy. [Color figure can be viewed in the online issue, which is available at wileyonlinelibrary.com.]