
Figure 1.
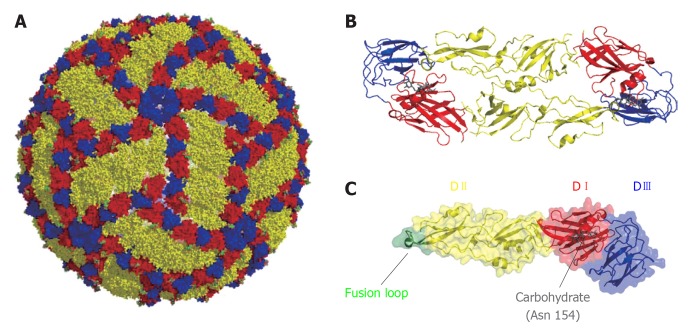
Organization of West Nile virus particle. A: Representation of West Nile virus particle based on cryoelectron microscopy data[230]. Glycoprotein E is shown on the surface of the particle. Color code: DI (red), DII (yellow) and DIII (blue); B: Ribbon diagram of a dimer of E glycoprotein; C: Structure of a monomer of the soluble ectodomain of E glycoprotein based on the atomic coordinates solved by X-ray crystallography[58]. Fusion loop is highlighted in green. The carbohydrate located at Asn 154 is shown in gray.