
Figure 6.
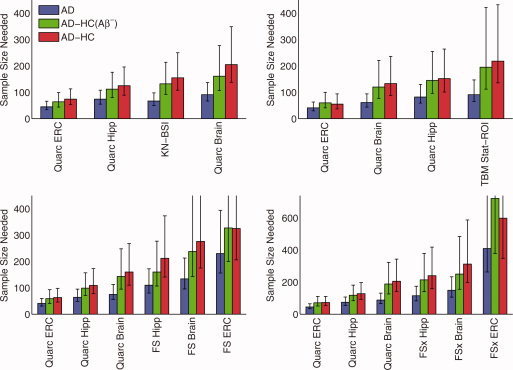
Estimated sample sizes for AD, as in Figure 4, but from pairwise head‐to‐head comparison of Quarc with BSI (123 AD subjects in common—see also Figure 5); TBM (97 AD); FreeSurfer‐longitudinal (FS; 107 AD); and FreeSurfer‐cross‐sectional (FSx; 129 AD; note different scale due to relatively poor performance for entorhinal cortex). P‐values for all head‐to‐head pairwise comparisons of measures are in Table V.