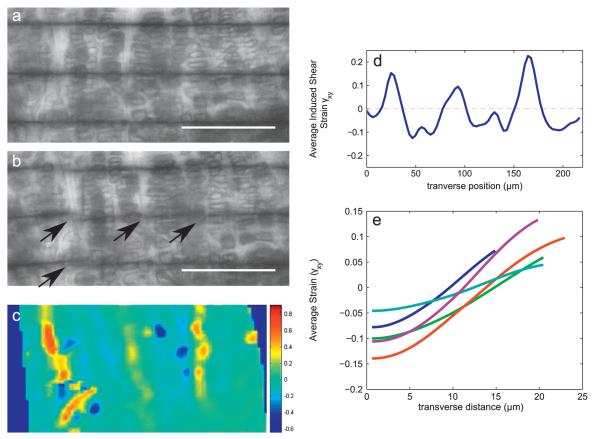
Fig. 4.
Transverse variation in induced shear strain γxy within the proliferative and hypertrophic zones. (a, b) Due to intercolumnar sliding, medial–lateral photobleached lines become discontinuous as growth plate is sheared. This slipping behavior results in large negative and positive shear strains between chondrons, as demonstrated by a map of γxy (c). (d) Averaging the γxy strain map of a single sample in the longitudinal direction produces a profile of strain as a function of transverse position, in which the bands of large positive strain observed in (c) manifest as regularly spaced peaks. (e) Average γxy as a function of transverse distance from the midpoint between the regions of slip for all (n=5) samples. Each curve in the plot represents the average of at least 5 traces from a single growth plate sample. Scale bars in (a, b) indicate 100 μm.

