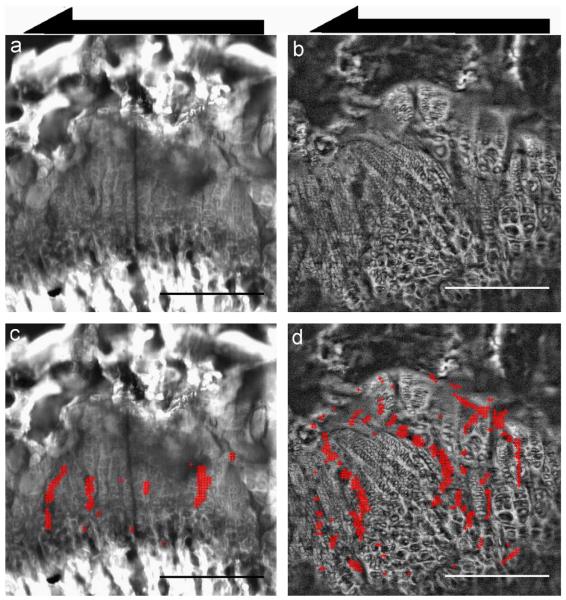
Fig. 5.
Local concentrations of induced shear strain γxy in the control (left) and vitamin D deficient (right) growth plates. (a, b) Representative confocal images of growth plates from control and vitamin D deficient rats indicating the direction of loading for mechanical testing. Growth plates from animals with vitamin D deficient diets exhibit extensive disorganization, with a discontinuous structure and columns of chondrocytes aligned in varying directions that were not parallel to the axis of growth. (Bottom) Superimposed on confocal images are markers denoting regions of high strain: the red + indicate locations where γxy exceeds 1 standard deviation above the average strain for each image. The black arrows indicate the direction of applied shear. As before, all tissue images are shown epiphyseal side up. Scale bars indicate 250 μm. (For interpretation of the references to color in this figure caption, the reader is referred to the web version of this article.)

