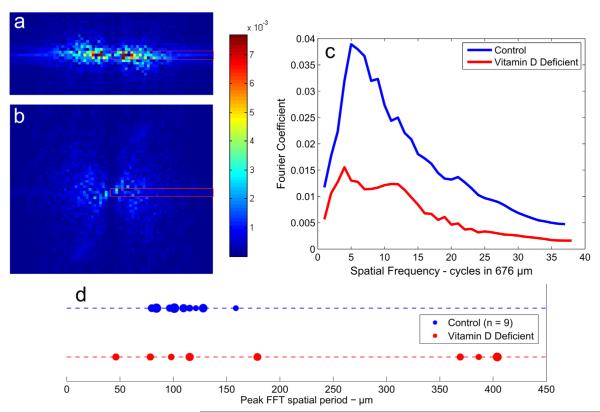
Fig. 6.
Two dimensional fast Fourier transforms (2D FFT) of strain fields γxy of growth plates shown in Fig. 5 ((a) control, (b) vitamin D deficient). These maps show the frequency distribution in spatial patterns of induced shear strain. The maps have been normalized to have a sum of 1, such that pixel intensity corresponds to the relative weight of that Fourier component in the reconstruction. (a) The high-magnitude horizontal band indicates that the strain field is strongly periodic in the horizontal and aperiodic in the vertical directions. The bright peaks indicate a single characteristic spatial frequency. (b) The 2D FFT of the vitamin D deficient growth plates is more widely distributed than that of the controls. (c) Comparison of the primarily horizontal Fourier components of the 2D FFT. The control specimen has a maximum Fourier coefficient at 6 cycles in the analyzed area. Since the analyzed area was 676 μm for this image sequence, this corresponds to a spatial period of about 676 μm=6 = 113 μm. The primarily horizontal components of the vitamin D deficient specimen 2D FFT does not have such a distinct peak and is smaller overall, the Fourier components being much more diffusing in both spatial frequency and direction. (d) A dot plot showing the spatial periods corresponding to the largest Fourier components of each of the Control and Vitamin D deficient FFT’s. Dot size is proportional to the maximum value of that FFT, such that FFT’s with a single large characteristic peak (indicating a very regular periodic spacing of shear concentrations) are represented by larger dots while flatter FFT’s are represented by smaller dots. The spatial periods of the control are clustered between 50 and 150 μm and have larger peak Fourier components while the dominant spatial periods in the vitamin D deficient FFT’s are more widely distributed and have slightly smaller peak Fourier components overall.

