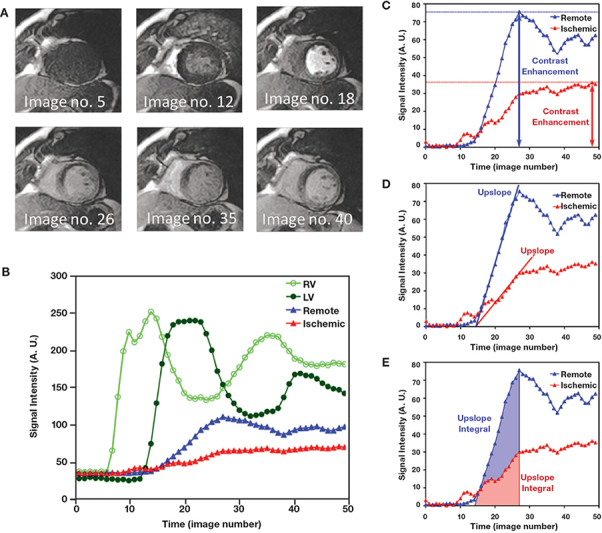
Figure 1.
(A) Qualitative interpretation of a first-pass myocardial perfusion study as a bolus of gadolinium contrast transits through the heart. Note that an anterior subendocardial perfusion defect appears starting at image no. 18 and persists at peak contrast enhancement (image no. 26) and later. (B) Time-intensity curves measured from a first-pass CMR perfusion study. The open green circles were measured in the right ventricular cavity. The dark green circles were measured in the left ventricular cavity. The blue triangles were measured in a sector representing normal vasodilated myocardium, while the red triangles came from a region of the myocardium with severely reduced perfusion (anterior subendocardium in this case). (C, D, E) Methods for semiquantitative analysis of perfusion. Common semiquantitative parameters in measuring myocardial perfusion include peak contrast enhancements, upslopes of the time-intensity curves, and upslope integrals. Courtesy of Andrew Arai, M.D., National Heart, Lung, and Blood Institute, National Institutes of Health, Bethesda, Maryland

