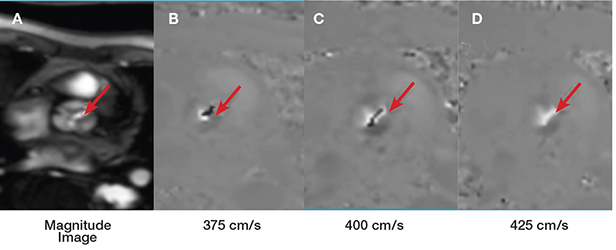
Figure 6.
Example of aortic valve peak velocity determination by the velocity encoding mapping sequence (VENC thru-plane). (A) The anatomical orientation is provided by the magnitude image. (B, C) Black pixels at the aortic valve represent aliasing of the velocity through the valve, which means that the true peak velocity is higher than the one encoded in the sequence. (D) This represents the VENC that correspond to the true peak velocity (no aliasing, white pixels inside the aortic valve), which in this case is 450 cm/s.

