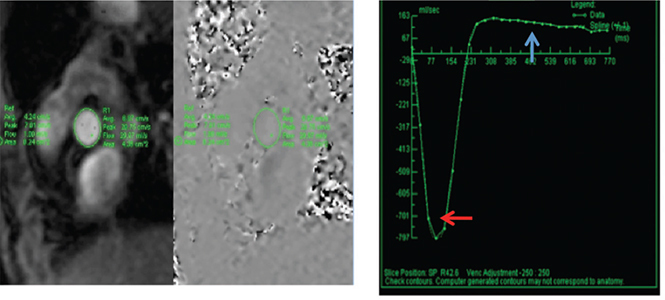
Figure 8.
In this phase-contrast sequence of a patient with aortic regurgitation, a region of interest (area) is traced at the aortic sinuses and for baseline correction at the subcutaneous fat (stationary tissue). The highest and lowest intensity pixels at the aortic sinuses represent the highest and lowest velocities. With area and velocity, a curve of flow vs. time can be plotted. The aortic stroke volume is calculated with the area under the curve (AUC) of the forward flow, and regurgitant volume can be determined with the AUC in diastole (blue arrow).

