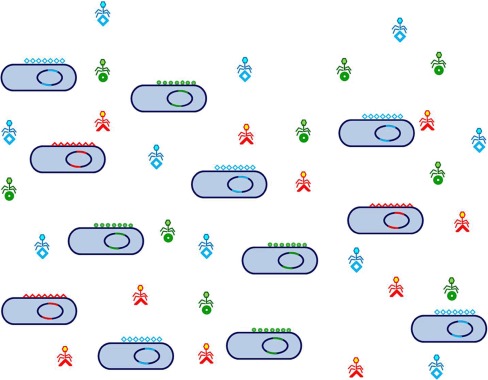
Figure 2. A prokaryotic population with cells and phages, as depicted by the Constant-Diversity model.

The genome is indicated as a solid blue circle (core) with two flexible genome islands fGIs (see text) in different colors to indicate different genes but coding for the same functions. The two fGIs indicated code for the O-chain of the lipopolysaccharide (in a Gram negative bacterium) and for a set of transporters. In reality there are many more fGIs (often four or five or more); further many differential transporters or other niche exploitation related features can be coded in small flexible islands or islets interspersed along the core, but they are all genetically linked to the O-chain and other surface related fGIs that are major recognition targets for phages. Three types of phages and receptors have been indicated, by different geometric forms. This set of cellular clones and phages is in equilibrium since the disproportionate increase of cells or phages is prevented by the density dependent kinetics of phage infection. For example if one clone increases over a certain threshold it will be over-preyed by its phages, until population returns to normal following a classical Lotka-Volterra predator/prey equilibrium. This is favorable for the meta-clonal population, since it keeps different lineages with complementary ecological skills acting in tune. This meta-clonal/viral population can be selected as an unit to exploit similar environments such as the water column in the ocean that is very similar worldwide.
