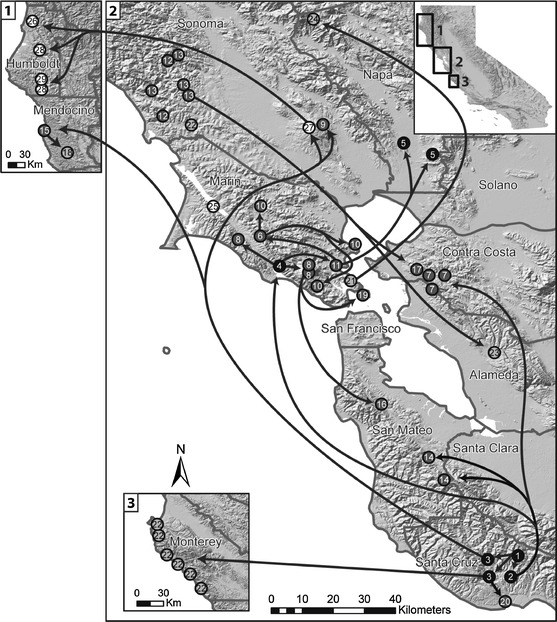
Fig. 1.

Map showing the major locations of the forests from which P. ramorum isolates were gathered and also representing the overall range of distribution of P. ramorum in California. Transmission routes supported by coalescent analysis are shown. Populations are shaded according to their likely membership in four genetic clusters: black with white text = cluster 1; dark gray with white text = cluster 3; light gray with black text = cluster 4, white with black text = cluster 2. Numbers refer to final populations collapsed into the same population if genetically undistinguishable within each county (Supplemental Table 1)
