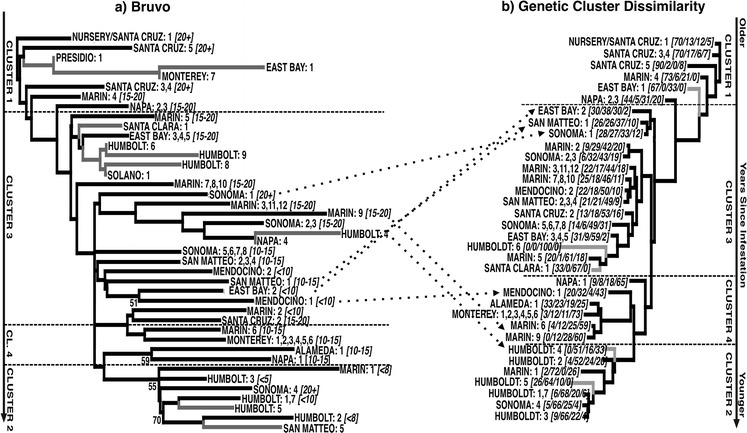
Fig. 2.

Neighbor-joining representations of the genetic relationships among P. ramorum populations. a NJ-tree based upon the Bruvo genetic distance: backbone-tree generated using populations with sample sizes ≥5, with populations of sample sizes 1–5 (grey branches) appended in PAUP* in a second step. Numbers in parentheses following the population names are years since infestation. b All populations with n > 1 clustered (NJ) according to Genetic Cluster Dissimilarity (1 genetic overlap) as derived from the structure defined genetic clusters. The numbers in parenthesis indicate the percent posterior probability of membership in each of the genetic clusters (1, 2, 3, 4) identified by structure. The vertical arrows to either side of the figures indicate the time-course from older to younger infestations. The horizontal dashed lines mark the boundaries of the genetic clusters as defined by NJ analysis (clustering) of the Genetic Cluster Dissimilarity index (the location of these lines is approximate in Fig. 2a). Populations moving markedly between representations in a, b are indicated by dotted arrows
