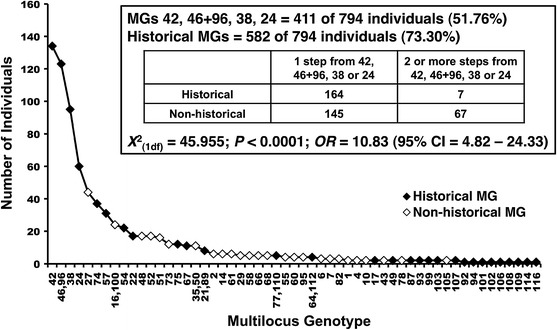
Fig. 4.

Plot showing the occurrence of 61 multi-locus genotypes (MGs) from the minimum spanning network MSN (see supplemental information), and whether they are “historical” or “non-historical”. Double labels on the x-axis (e.g. 46.96 or 16.100) indicate genotypes that had no “distance” between them because they are identical except at null alleles. Inset test indicating that common MGs are more likely to be old (“historical”), with one-step neighbors of the four most common MGs being almost 11 times more likely to be historical than MGs two-or more steps removed from the most common genotypes. Non-historical singleton MGs were excluded from this plot and the inset—including them makes one-step neighbors of the four most common MGs being almost 20 times more likely to be historical than MGs two-or more steps removed from the most common genotypes (OR = 19.55 (95 % CI = 8.84–43.26); χ2 = 86.117, P ≪ 0.0001)
