Figure 1.

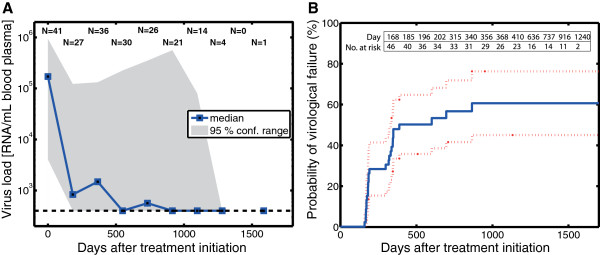
Viral Load Dynamics and Probability of Virologic Failure. A: Central tendency of the viral load dynamics after treatment initiation. The solid blue squares indicate the median viral load for all patients together with the confidence range spanned by the 5th and 95th percentiles (grey shading). The numbers at the top of the figure, e.g. N = 30, indicate the number of patients that gave rise to the estimates of the median viral load and its confidence area for the respective time points. B: Kaplan-Meier estimate of the cumulative probability of virologic failure after treatment initiation.
