
Figure 2. The same quality acceptance curves as in Figure 1.
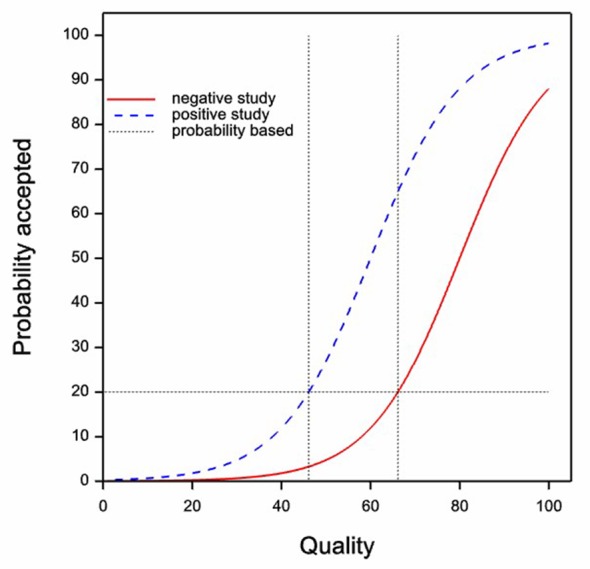
This time however, it is supposed that authors make their decision to submit based on probability of acceptance. As before, the solid red curve gives the probability of acceptance for negative studies and the dashed blue curve for positive studies. The horizontal dashed line shows a postulated probability threshold for submission and the vertical dashed lines indicate the quality thresholds that would result.