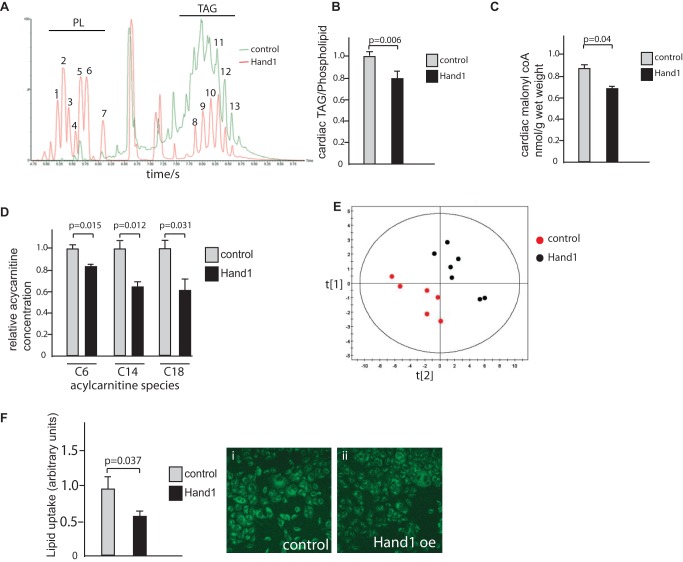
Figure 4. Lipid metabolism is inhibited in neonatal Hand1 overexpressing hearts.
(A) LC-MS trace showing typical output for intact lipid extracted from control hearts (green trace) and Hand1 up-regulating hearts (red), showing significantly lower levels of triacylglycerides (TAG) compared to phospholipid (PL) in Hand1 up-regulating hearts. (B) Quantitative analysis of cardiac triacylglyceride levels showing significant reduction in Hand1 up-regulating hearts, expressed as the ratio of TAG to phospholipid (n = 6 each group, p = 0.006, two-tailed t test). (C) Quantitative analysis of cardiac malonyl coA levels showing significant reduction in Hand1 up-regulating hearts (n = 6 each group, p = 0.04, two-tailed t test). (D) Reduced levels of C6, C14, and C18 containing acylcarnitine species in Hand1 prolonging neonatal hearts compared with controls. For full dataset, please refer to Table S3. (E) Multivariate partial least squares discriminant analysis (PLS-DA) scores of acylcarnitine profiles showing a significant decrease in global levels of acylcarnitines in Hand1 up-regulated hearts relative to controls (R2X = 33%, R2Y = 62%, and Q2 = 48%). (F) BODIPY-500/510C1, C12 uptake is significantly reduced in HL1 cells by transfection with Hand1. Graph shows quantification of fluorescence in Hand1 transfected and nontransfected controls, 10 high power fields each. (i) and (ii) show representative fluorescence micrographs of control and Hand1 transfected cells following labeled lipid incubation (p = 0.037, two-tailed t test).

