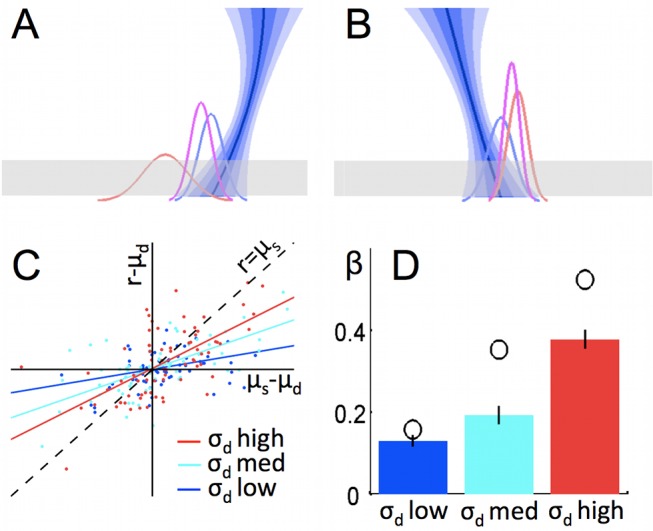
Figure 2. Weighted (Bayesian) combination of predictions.

(A and B) On each trial, we hypothesised that participants would make a probabilistic estimate of the trajectory endpoint, using the dynamic forward model (the best estimate of the trajectory and the distribution of possible trajectories is shown by the blue descending line; the corresponding distribution of possible endpoints is shown by the blue Gaussian curve), and that participants have a statistical model of the underlying Gaussian distribution of endpoints over many trials, which is also probabilistic (red Gaussian curve). The optimal way to combine predictions is by precision-weighting (purple). When the trajectory has relatively little noise, (A) the combined estimate of trajectory endpoint is more strongly influenced by the prediction from the dynamic forward model than the statistical model, and vice versa (B). (C) Actual data from a single human participant. Each data point is one trial. On the x-axis is displacement of the true trajectory endpoint (x) from the mean of the statistical distribution (μs). On the y-axis, displacement of the participant's response (r) from the true trajectory endpoint (x), towards the mean of the statistical distribution (μs). If participants relied only on the statistical distribution over many trials, then r would be equal to μs, and hence all points would lie on the line x = y (marked “r = μs”). In contrast, if participants disregarded the statistical model, then responses would simply be centred around the true trajectory endpoint x, and hence all points would be distributed about the x-axis (y = 0). Data points are binned by dynamic model noise level. Responses are more influenced by the statistical distribution (closer to the line x = y and further from the line y = 0) when the observed trajectory is most noisy and therefore the dynamic model is least informative. (D) This effect is significant across the group: bars show mean regression line slope (β) for each bin of trials; error bars are s.e.m. Open circles represent the regression slope for the responses made by the optimal Bayesian observer (weighted combination of predictions with optimal weighting) for the trials in each bin. In a repeated-measures ANOVA for the group of 22 participants, there was a significant linear effect of trajectory noise bin on displacement of the response towards the mean of the statistical distribution (p = 0.02). All slopes were significantly above zero (p<10−7). The slope for σd med is significantly higher than for σd low (p = 0.0046, paired samples t test) and the slope for σd high is significantly higher than for σd med (p<0.00005, paired samples t test).
