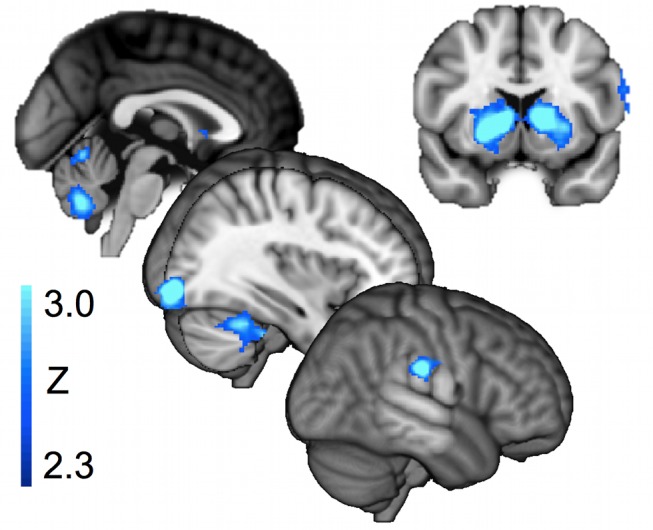
Figure 4. Brain regions associated with the dynamic forward model.

Activity correlated with the precision of prediction from the dynamic forward model. Cortical activity and subcortical activity in cerebellum and caudate. The figure shows group Z-maps for the 22 participants, thresholded at p<0.05 corrected (see Methods). A full table of activation peaks is given in Table S2.
