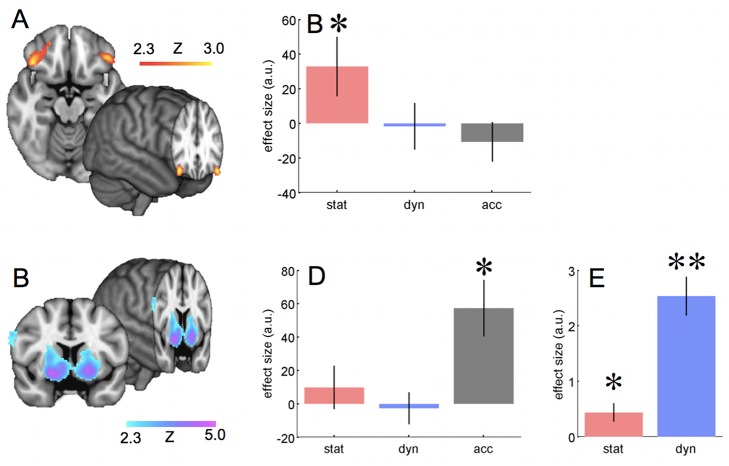
Figure 5. Activity associated with the statistical model and with accuracy.
(A) Activity correlated with the precision of prediction from the statistical model. The figure shows group Z-maps for the 22 participants, thresholded at p<0.05 corrected (see Methods). (B) Parameter estimates for the effect of precision of the statistical model, precision of the trajectory estimate, and trial-to-trial accuracy, for a region of interest in the orbitofrontal cortex, defined based on a meta-analysis [65]. Bars show group mean, and error bars show s.e.m. Note that although there is a significant effect of precision for the statistical model (p = 0.036, one sample t test against zero), there is no effect of accuracy per se (p = 0.82) or of the precision of the dynamic model (p = 0.55); note, in the region of interest analysis, accuracy is not orthogonalised with respect to model precisions, so the effects of model precision are independent of variance that could also be explained by overall accuracy. This is why effect sizes look slightly different to in Figure 6. (C) Activity relating to trial-to-trial accuracy. The figure shows group Z-maps for the 22 participants, thresholded at p<0.05 corrected (see Methods). Note the strong peak in the ventral striatum. Slice location is y = 6, peak effect at 20, 6, −10, Z = 4.8. In the whole brain analysis, accuracy was orthogonalised with respect to the model precisions, with which it was correlated (as in panel E). (D) Parameter estimates as in (B), but for a region of interest in the ventral striatum, defined using the nucleus accumbens mask from the Harvard-Oxford atlas, available in FSL (www.fmrib.ox.ac.uk/fsl). Note that this ROI is strongly affected by overall accuracy (p = 0.0015, one sample t test against zero) but not by the precision of the statistical (p = 0.23) or dynamic (p = 0.61) models. (E) Behavioral effects of precision of the statistical model and trajectory estimate on accuracy. Bars show group mean ± s.e.m. effect size from a multiple regression of accuracy on precisions for the two models. The effect of precision for both the statistical and dynamic models were significant (t test versus zero, p<0.01 and p<0.0001, respectively), but the effect of dynamic model precision was much greater (paired t test, p<0.0001).

