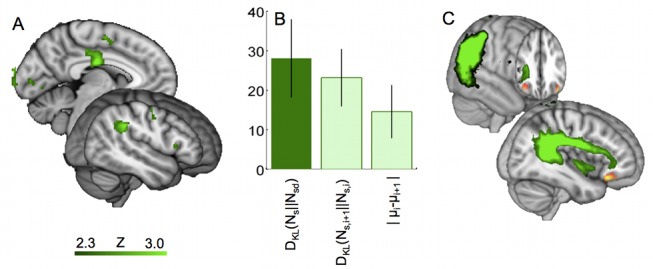
Figure 6. Angular gyrus is a possible site for the formation of the combined prediction.

(A) Activity correlated with the degree to which the statistical model must be updated with dynamic information to obtain the combined predictions:  as defined in Equation 3. This statistical map shows results corrected for multiple comparisons using cluster-based correction as described in the Methods section. A full table of activation peaks is given in Table S2. (B) Effects for three measures involving the statistical model, in the angular gyrus. An ROI was defined in the angular gyrus, as all voxels with p<0.01 for the effect of divergence between the statistical and combined models,
  as defined in Equation 3. The group effect is plotted, within this ROI for (i) the degree to which the statistical model must be updated with dynamic information to form the combined prediction
  —this was the contrast based on which the ROI was defined so suffers from selection bias—the result is replotted here only for reference; (ii) the degree to which the statistical model is updated between trials,
  as defined in Equation 4; and (iii) the change in the mean prediction of the statistical model between trials,
  as defined in Equation 5. (C) Diffusion tractography from angular gyrus. Figure shows probabilistic tractography results for a group of 65 subjects, showing the connections of the region in angular gyrus that was active during updating of the statistical model. Connectivity to lateral OFC via the superior longitudinal fasicle can clearly be seen. The image shows, in green, the strength of connectivity of the functionally identified angular gyrus region to each voxel, defined as the average number of “particles” originating in the angular gyrus region which pass through each voxel. The image is thresholded at 1% of total “particles” (minimum) and 10% (maximum). The red region in OFC is the area significantly correlated with the trial-to-trial precision of the statistical model.
