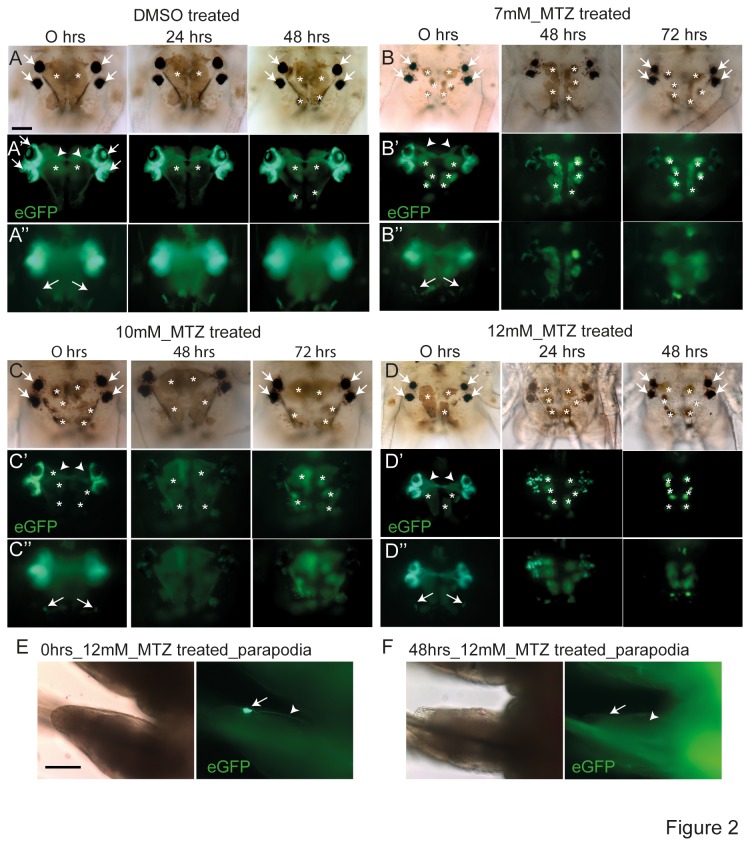
Figure 2. Metronidazole-dependent loss of eGFP fluorescence indicates an effect on r-opsin1+ PRCs in transgenic animals.
All images show live immature adult r-opsin1::egfp-f2a-ntr transgenic animals (10-20 segments). (A-D) Concentration- and incubation time-dependent loss of eGFP fluorescent cells from adult eyes and frontolateral eyelets. Animals were treated with DMSO (A-A”) or varying concentrations of metronidazole (B-B”: 7mM, C-C”: 10mM; D-D”: 12mM). Duration and type of treatment are indicated on top of each panel. Arrowheads point at the axonal projection from the adult eye photoreceptors. Asterisks: head pigment cells that show autofluorescence in the channel used for eGFP documentation. These pigment cells expand or contract depending on light intensity and time of day. Arrows indicate adult eye pigments (panels A-D) position of eGFP-expressing PRCs (panel A’), position of lateral frontal eyelets (A”-D”). (E,F) Loss of eGFP fluorescent non-cephalic PRC upon metronidazole treatment. (E) Parapodium with eGFP-expressing non-cephalic PRC (arrow) and its axonal projection (arrowhead) before metronidazole treatment; (F) same specimen after 48 hrs of exposure to 12mM mtz, with arrow and arrowhead indicating the same positions. Scale bars: 50µm.

