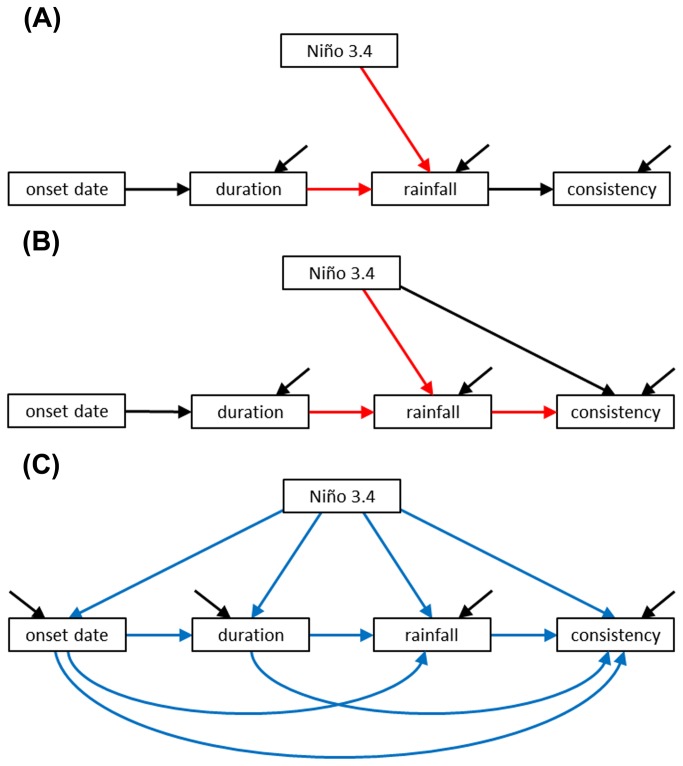
Figure 1. Conceptual causal diagrams describing relationships among descriptors of ENSO and the seasons.
We designed these models for (A) the dry season and (B) the wet season based on relationships that have support from previous studies (see text). Arrows are coded to represent predicted effects (black = negative effect, red = positive effect). Using these starting models as a basic framework, we designed a third model (C) which specified all possible relationships among the seasonal descriptors (blue arrows). This latter model was saturated and was used to produce exploratory models using Amos’s model specification procedure. In all panels, diagonal black arrows represent error terms.

